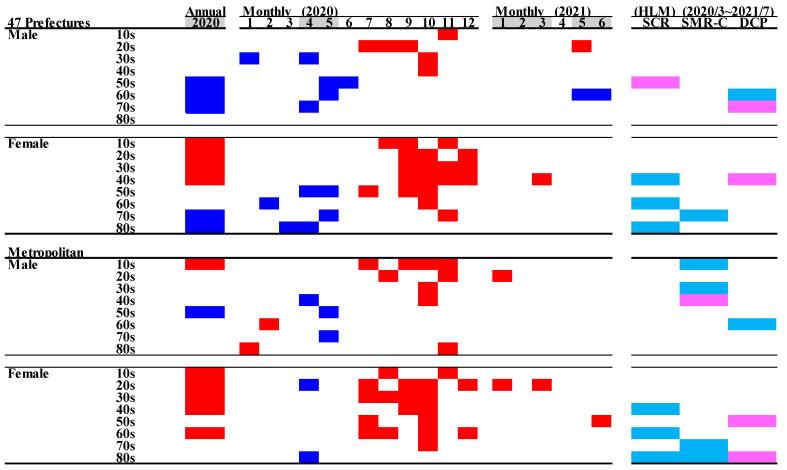
Figure 5.
Comparison of annual and monthly SMR-S disaggregated by age during the pandemic period compared to the average SMR-S of the same month during the pre-pandemic period, and impact of COVID-19 pandemic on SMR-S in Japan. Blue and red columns indicate significant decreasing and increasing suicide mortality using a linear mixed-effects model with Tukey’s multiple comparison (p < 0.05). Light blue and red columns indicate significant decreasing and increasing factors against SMR-S using hierarchical linear model with robust standard error (p < 0.05). SMR-S: standardised suicide mortality per 100,000 people. SCR: standardised infection with COVID-19 per 100,000 people. SMR-C: standardised mortality caused by COVID-19 per 100,000 people. DCP: during COVID-19 pandemic.

