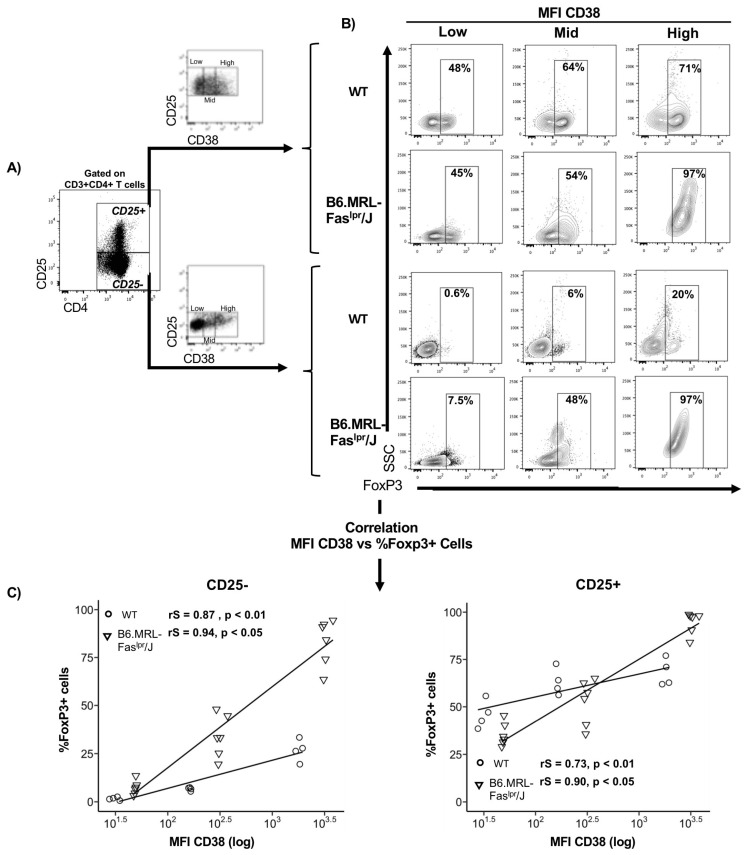
Figure 1.
The level of CD38 correlates with FoxP3 frequency in T CD25+ and CD25− T-cells. Splenocytes were stained for cell surface expression of CD3, CD4, CD25, and CD38. The stained cells were fixed and stained intracellularly for FoxP3. (A) Splenocytes from wild type (WT) and B6.MRL-Faslpr/J were gated on CD3+CD4+ cells and analyzed for CD25 expression. Then, CD3+CD4+CD25+ or CD25− cells were gated on CD38low, CD38mid, or CD38high, according to CD38 expression; (B) counter plots showing FoxP3+ cells frequency in CD38low, CD38mid, or CD38high subsets among CD25+ and CD25− T-cells from WT and B6.MRL-Faslpr/J; (C) correlation plots comparing MFI of CD38 to FoxP3+ cells within either CD4+CD25− T-cells (top) or CD4+CD25+ T-cells (bottom). Symbols represenT-cells from WT (n = 4) (open symbols) and B6.MRL-Faslpr/J (n = 6) (filled symbols). The inset lines are the product of linear regression analysis. Correlations were calculated by the Spearman method.

