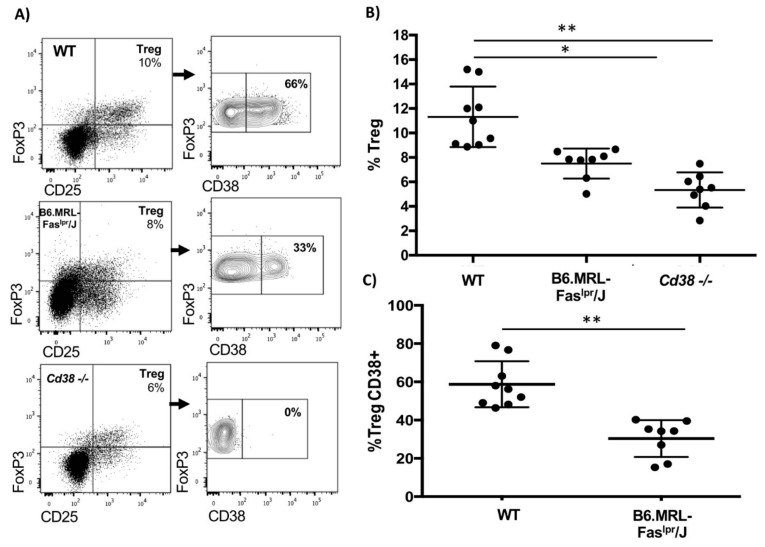
Figure 3.
Reduced CD38+ Treg levels in B6.MRL-Faslpr/J mice. (A) Representative dot plots of the frequency of Treg cells in splenocytes from WT, B6.MRL-Faslpr/J and CD38-/-. The dot plots’ right is representative contour plots showing CD38 expression gated on splenic Treg cells from WT (n = 9), B6.MRL-Faslpr/J (n = 8), and CD38-/- mice (n = 8); (B) scatter dot plot shows mean ± SD of Treg frequency from WT, B6.MRL-Faslpr/J and CD38-/- mice. Statistical analysis was performed using one-way ANOVA. Differences between groups were indicated by Tukey post hoc test, where * p < 0.001, ** p < 0.0001; (C) scatter dot plot shows mean ± SD of CD38+ Treg frequency from WT and B6. MRL-Faslpr/J mice. Statistical analysis was performed using Student t-test, where ** p < 0.0001.

