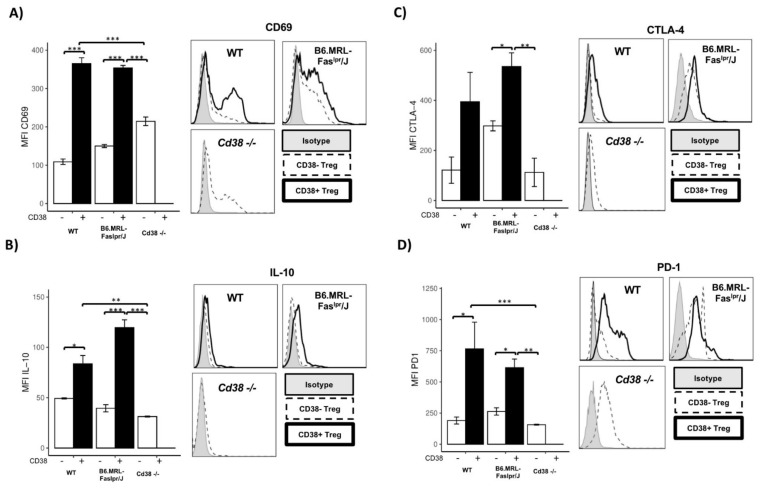
Figure 4.
Treg from CD38-/- showed a reduction in immunosuppressive molecules. Histograms and bar charts represent the expression of (A) CD69, (B) IL-10, (C) CTLA-4, and (D) PD-1 among CD38− and CD38+ Treg cells from WT (n = 4) and B6.MRL-Faslpr/J (n = 4) mice or splenic Treg cells from CD38-/- (n = 4) mice. Bar charts show mean ± SD. Statistical analysis was performed using two-way ANOVA followed by Tukey test, where *** p < 0.0001, ** p < 0.001, and * p < 0.05.

