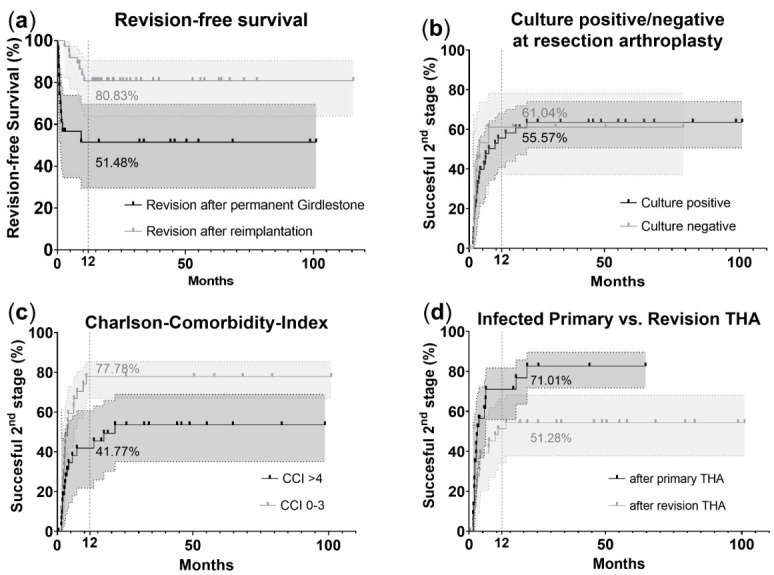
Figure 1.

Kaplan–Meier curves illustrating the likelihood for (a) revision-free survival, (b) positive/negative cultures at resection arthroplasties, (c) Charlson comorbidity index (CCI) and (d) reimplantation after primary and after revision total hip arthroplasties. The Kaplan–Meier curves show plotting outcomes for two different groups in each analysis and its 95% CI interval. p values reflect the probability of a failed outcome in patients with CCI > 4 and resection arthroplasties after revision surgeries, as well as a high re-revision rate in patients with a permanent Girdlestone situation. Total hip arthroplasties (THAs).
