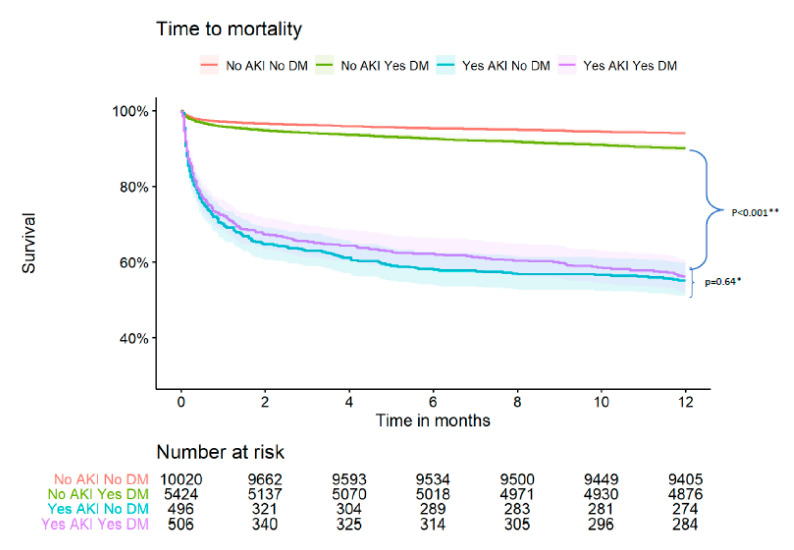
Figure 1.
Kaplan Meier survival curve by DM status and AKI. * p for comparison between the following groups: AKI_ DM vs. AKI_no-DM (comparison between diabetic patients with AKI vs. non-diabetic patients that developed AKI). ** p for comparison between the following groups: AKI_DM vs. no-AKI_DM (comparison between diabetic patients with AKI vs. diabetic patients that did not develop AKI).

