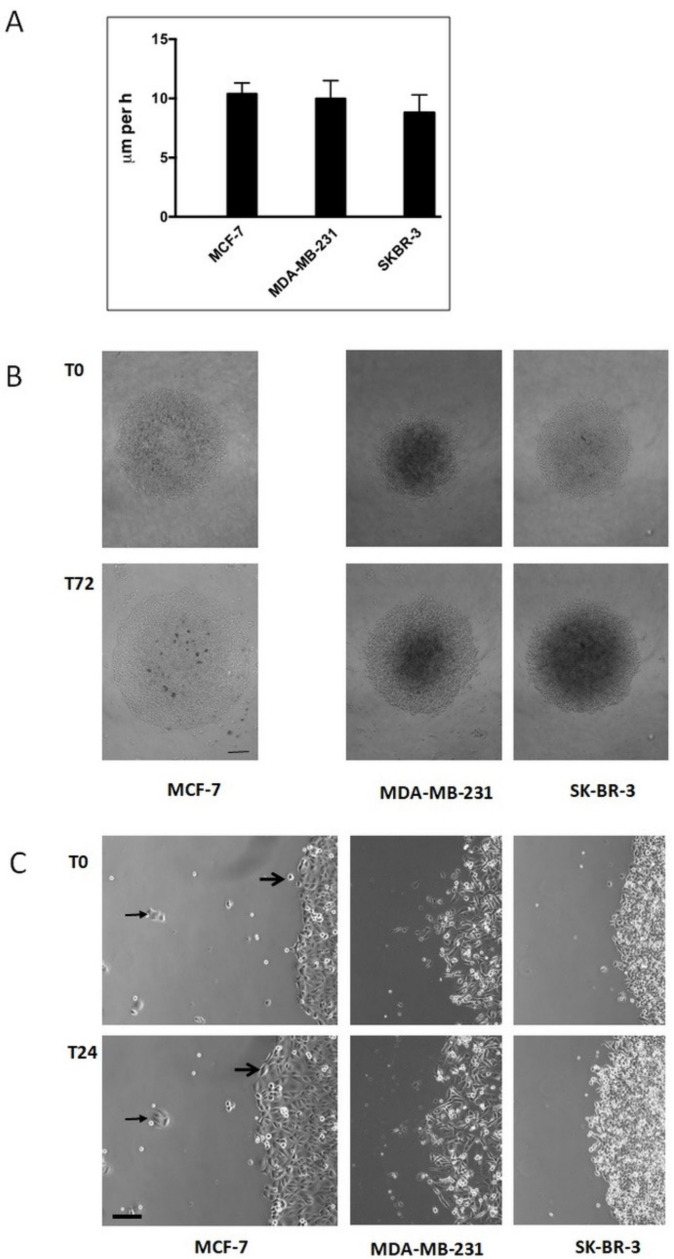
Figure 2.
Collective cell migration of breast carcinoma cells cultivated on plastic surfaces. (A) Histogram shows the increase in the diameter (given in μm per h + SD) of circular areas covered with a confluent layer of breast carcinoma cells after three days in culture (for MCF-7 cells, see subfigure (B)). At least twelve circular areas were measured per experiment and at least three independent experiments per cell line were performed. (B) Low-magnification micrographs of representative circular areas covered with a confluent layer of breast carcinoma cells at the onset of the experiment (T0) and three days later (T72) (bar, 200 μm). (C) High-magnification micrographs of the borderline of circular areas covered with confluent layers of breast carcinoma cells at the beginning of the experiment and one day later (T24) (bar, 60 μm). For MCF-7 cells, big arrows mark the changing position of a single cell that becomes integrated in the cell collective. Small arrows mark the constant position of a small cell cluster outside the cell collective.

