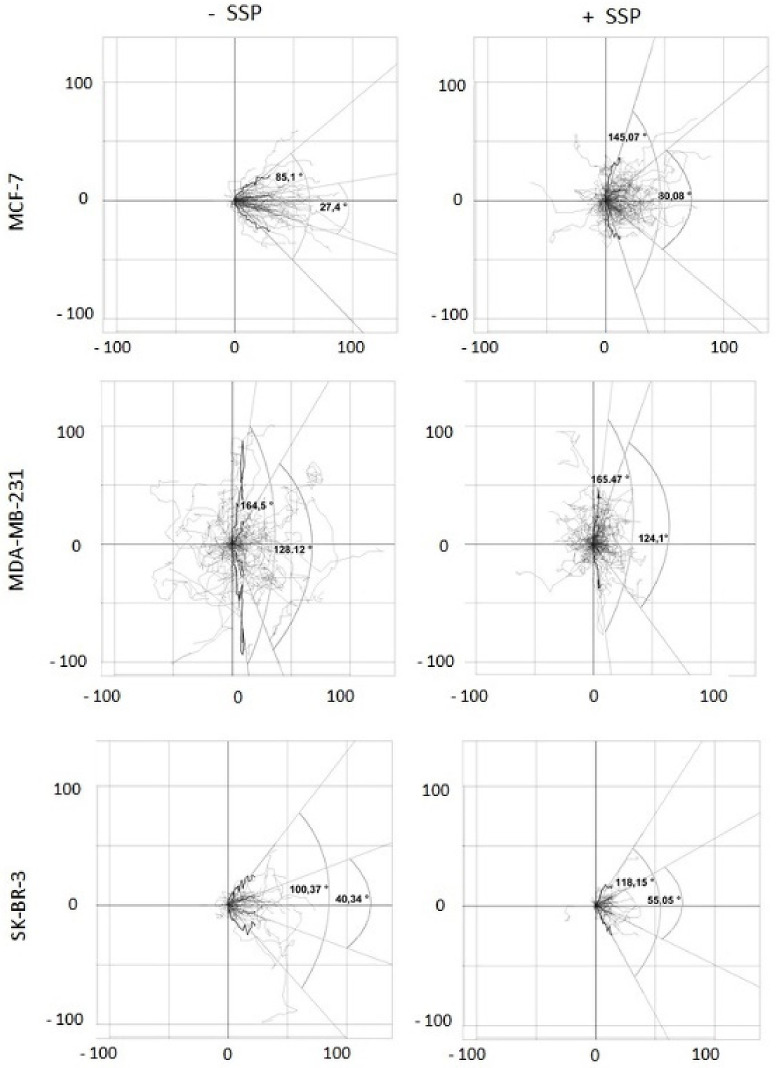
Figure 6.
Two-dimensional analysis of the migration pattern of collective border breast carcinoma cells. Collective breast carcinoma cells were allowed to migrate for 24 h in the absence (-SSP) or presence (+SSP) of 50 nM of SSP. The paths of at least 40 carcinoma cells derived from two independent experiments were recorded and integrated into a 2D coordinate as a series of coordinates. With the help of especially designed R-scripts, the different starting points of all cells at T0 were superimposed in the intercept of the “zero” lines in all subfigures, and then the corresponding paths (shown in light grey) were integrated into the 2D coordinate system. Thereby, the paths were reoriented such that the main direction of migration on the abscissa was oriented to the right (see Figure 5B as a comparison). Each black curved line represents a “summarised path” which was calculated for each time point for the position of all individual cells analysed at a certain time point (total time span 24 h, divided from T0 to T72 in 20 min intervals). The individual coordinates of the “summarised path” are based on box and whisker plots for each time point. Hereby, on the X-coordinate, the medians of all 20 min intervals for all cells are presented, whereas on the Y-coordinate, the corresponding lower and upper whisker values or the lower Q25 and upper Q75 quartile values are provided. This set of individual coordinates represented by the summarised paths allows the generation of regression lines. The raise of such regression lines can vary between 0 and 90 degrees, or 0 and –90 degrees, respectively. The angles which can thereby be generated express borders defined by either the lower and upper whiskers (wider angles) and encompass the majority of all path segments, or the lower Q25 and upper Q75 quartile (narrower angles) and encompass 50% of all path segments. Numbers at the X- and Y-axes represent μm.

