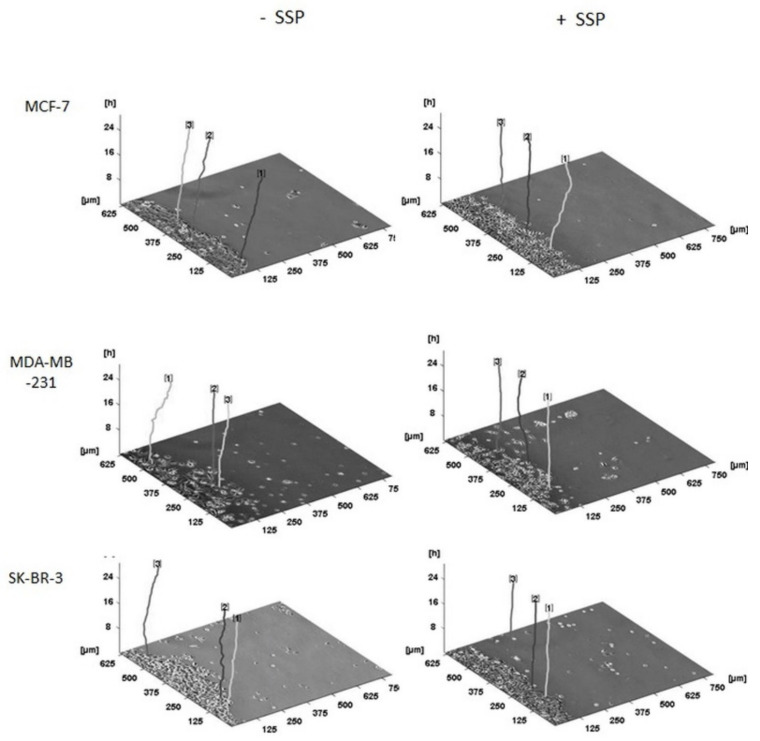
Figure 7.
Three-dimensional migration pattern of selected collective borderline breast carcinoma cells. Collective breast carcinoma cells were allowed to migrate for 24 h in the absence (–SSP) or presence (+SSP) of 50 nM of SSP. The main direction of migration is oriented to the right. The time-dependent (z-axis) paths of three representative carcinoma cells (located in the borderline of the cell collective) per cell line and treatment are shown. For all paths, the endpoint on the z-axis is located at the 24 h position. Thus, the total length of the individual lines may differ, based on a variation of the curvature of the paths. Processing of the primary data was performed with the program “CellTracker” that allows the documentation only in pixel format. One pixel was then converted to 1.25 μm. Numbers at the top of the paths were automatically set by the program.

