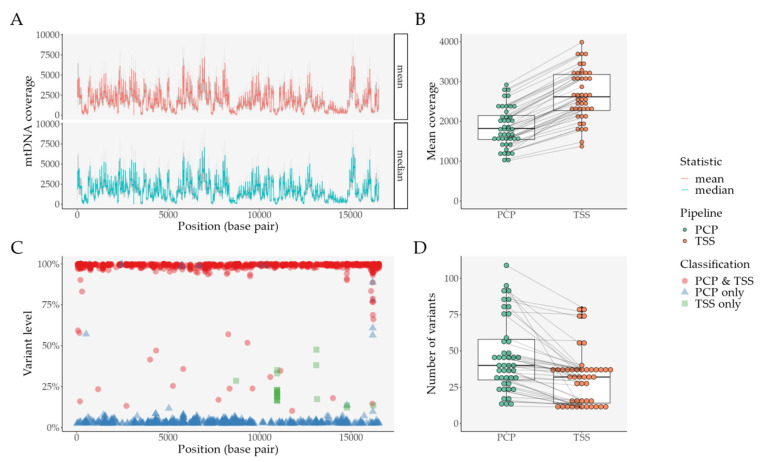
Figure 5.
Comparison between PCP and TSS in an independent set of samples (after filtering, N = 45) derived from clinical practice (an ischemic stroke prospective cohort). (A) Coverage per base pair with PCP data, per statistic (mean and median)—the grey area represents the standard deviation of each statistic per base pair; (B) Mean coverage per sample and per pipeline—lines connect the same sample; (C) Distribution of variants per base pair and per variant classification—for variants found in PCP and TSS, mean variant level was plotted; (D) Mean number of variants per sample and per pipeline—lines connect the same sample. Abbreviations: PCP—PrecisionCallerPipeline; TSS—Ion Torrent Suite™ Software.

