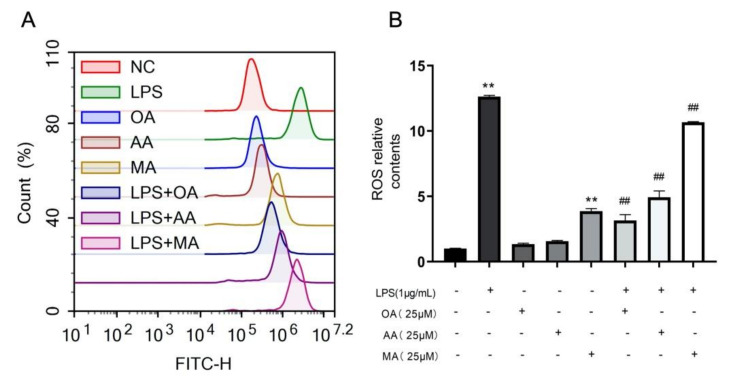
Figure 4.
Effects of OA, AA, and MA on ROS content. (A) Macrophages were incubated with OA, AA, and MA at 25 μM for 10 h (with or without LPS). DCFH2-DA staining was performed for 30 min. Fluorescence intensity was detected using flow cytometry. (B) Data analysis of ROS production in each group. All data are expressed as the mean ± SD. ** p < 0.01 vs. control group. ## p < 0.01 vs. LPS-treated group.

