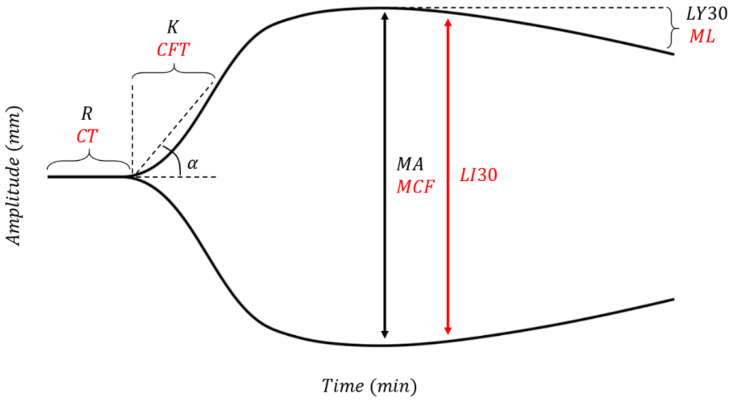
Figure 2.
A typical graphical output of TEG® (parameters shown in black) and ROTEM® (parameters shown in red). R (Reaction Time)/CT (Clotting Time) denotes the time taken for blood to begin initiation of enzymatic clotting factor activation (marked by a movement of 2 mm along the y-axis). K/CFT (Clot Formation Time) denotes the time taken for movement of the pin by 20 mm along the y-axis. The α-angle is software-calculated using the slope of the secant line from the split point of the curve to K [111]. Clot kinetics are typically determined by K and α-angle, which together describe clot-strengthening rate and the cleavage of fibrinogen to fibrin by thrombin. Maximum Amplitude (MA) or Maximum Clot Firmness (MCF) denotes the peak of the curve and the point of greatest platelet-fibrin interaction [105,107]. Lysis at 30 min (LY30) is measured 30 min after MA as a percentage dissolution from MA peak. LI30 (Lysis Index at 30min) is measured as the amplitude 30 min after CT. Maximum Lysis (ML) is expressed as a percentage dissolution from MCF peak at the time of evaluation during the performance of the test and is roughly equivalent to the LY30 [43,106,107,108,112].

