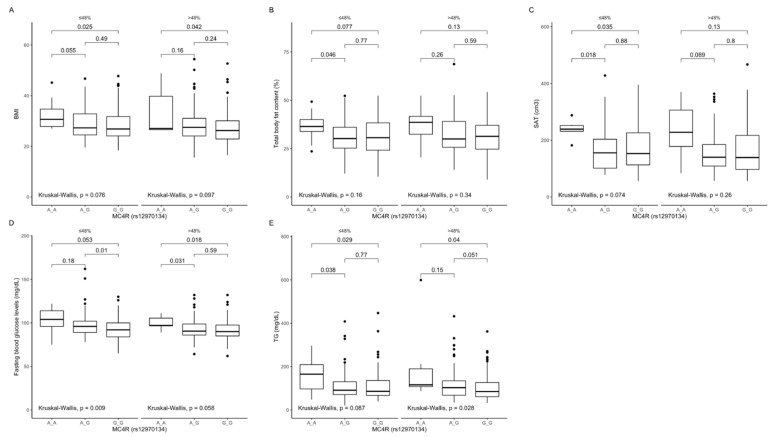
Figure 5.
Association of MC4R rs12970134 genotypes with (A) BMI (kg/m2), (B) total body fat content (%), (C) SAT (cm3), (D) fasting blood glucose concentrations (mg/dL), and (E) TG concentrations (mg/dL), by dietary carbohydrates intake strata: ≤48% and >48% of total daily energy intake. BMI, Body Mass Index; SAT, subcutaneous adipose tissue; TG, tri-glycerides.

