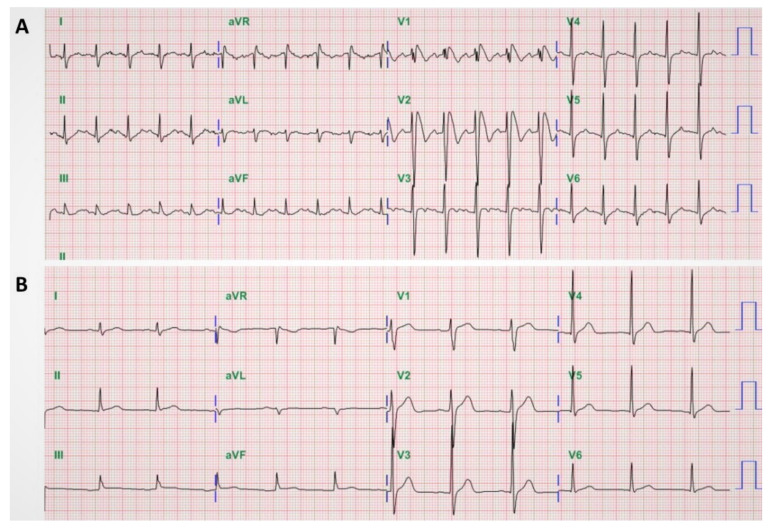
Figure 1.
Fever-induced Brugada electrocardiography (ECG) pattern. A 45-year-old man was admitted with diarrhea and abdominal cramps for 2 days. He was febrile (temperature, 40 °C) with tachycardia (pulse, 127 beats/min): (A) ECG on admission revealed a right bundle-branch block with coved ST-segment elevation in V1–V2 followed by a negative T wave; (B) repeated ECG after fever resolved showed normalization of the ST-segment elevation, as well as disappearance of the right bundle-branch block.

