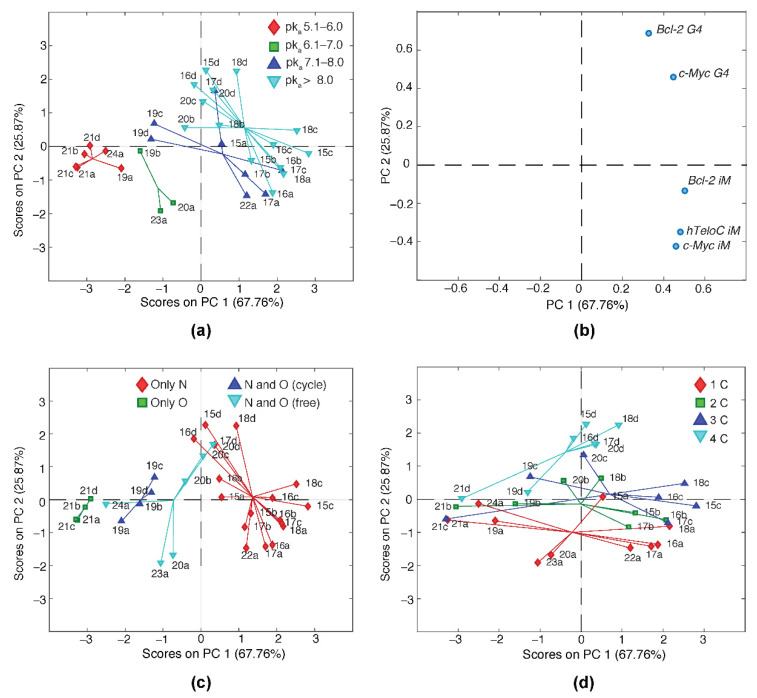
Figure 2.
Output of the PCA model performed on the ΔT1/2 values dataset of the 31 compounds tested on Bcl-2 G4, c-Myc G4, Bcl-2 iM, c-Myc iM, and hTeloC iM DNAs. PC1/PC2 scores plot colored according to the (a) pKa value corresponding to the conjugated acid of the strongest basic group in each molecule (c) presence/absence of both nitrogen and oxygen atoms in the side chains, and (d) length of the R side chain (from 1 up to 4 carbons); (b) PC1/PC2 loadings plot.

