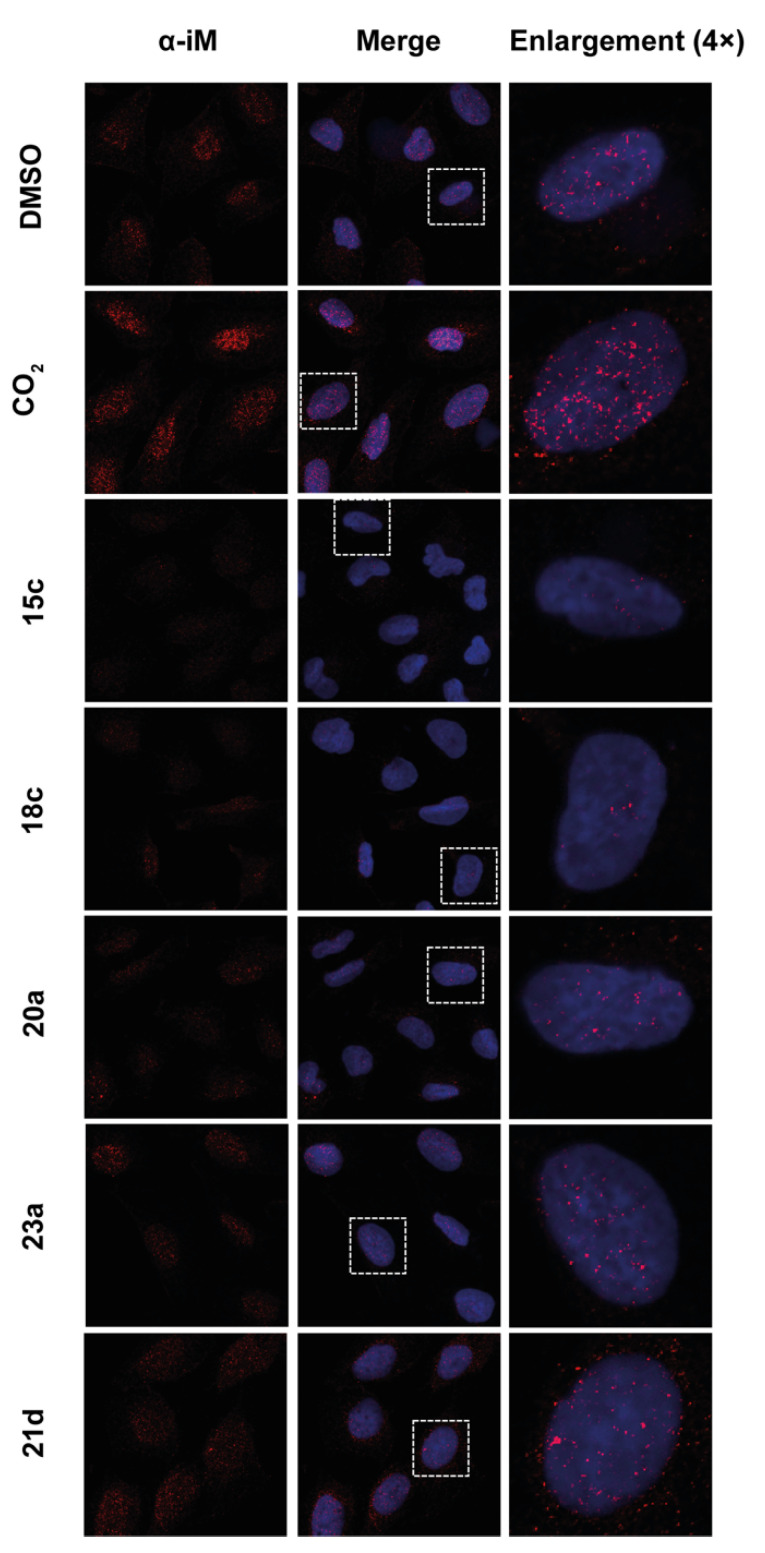
Figure 6.
Biological evaluation of the iM-destabilizing activity of the selected compounds. Immunofluorescence analysis of iM structures in U2OS cells treated for 24 h with 2 µM of the selected compounds or an equivalent amount of DMSO (negative control). As a positive control, cells were maintained for 2.5 h in an atmosphere with 8% of CO2. Representative images of confocal sections (63×) used to detect iM structures are shown. Left panels: iM structures (red) detected by anti-iM antibody (-iM). Middle panels: merged images showing iM structures (red) and DAPI counterstained nuclei (blue). Right panels: 4× enlargements from the pictures in the middle panels. The experiment was performed in triplicate and at least 9 fields/experiments were evaluated for each condition. Scale bars are reported in the figures.

