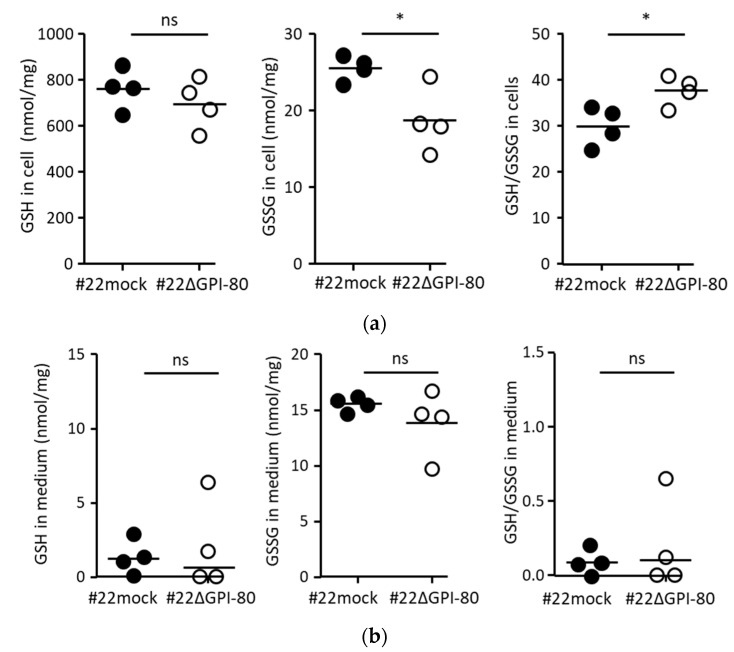
Figure 2.
The ratio of GSH/GSSG was augmented in GPI-80-expressing cells. (a) The measurement of intracellular GSH/GSSG. The cells were cultured for 3 days, and approximately, 1 × 10⁷ cells were collected using a cell scraper. The intracellular GSH (left panel) and GSSG (middle panel) levels were measured using the cell lysate from #22mock (closed circle) and #22ΔGPI-80 (open circle) cells. The GSH and GSSG values (nmol/mg) were used for calculating the ratio of levels of GSH/GSSG (right panel). (b) The measurement of levels of GSH/GSSG in the conditioned medium. The cells were cultured for 3 days, and the media were collected. The levels of GSH (left panel) and GSSG (middle panel) were measured using the conditioned medium from #22mock (closed circle) and #22ΔGPI-80 (open circle) cells. The GSH and GSSG values (nmol/mg) were used for calculating the ratio of levels of GSH/GSSG (right panel). The data are representative of four independent experiments, and the statistical significance was calculated using two-tailed unpaired Student’s t-test (*, p < 0.05; ns, not significant).

