Figure 5.
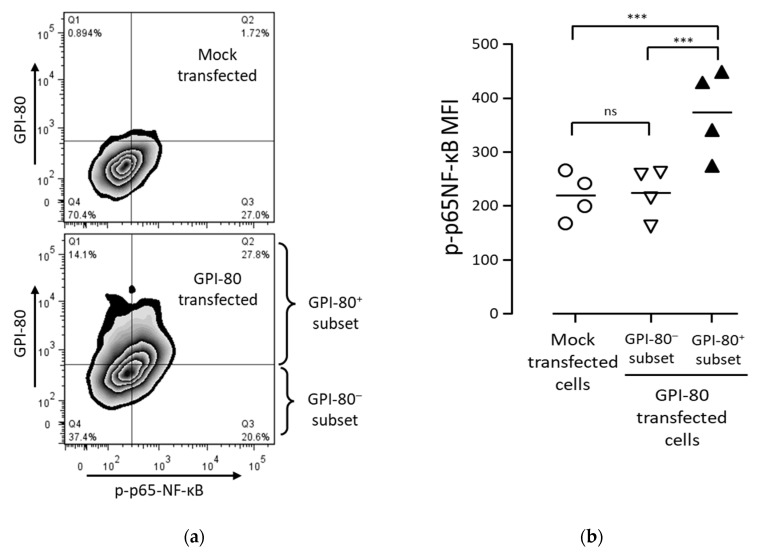
The relation between GPI-80-expressing cell subset and the activated NF-κB cell subset. (a) The representative flow cytometric analysis of GPI-80-expressing cell subset and activated NF-κB cell subset. PC3 cells were transfected with lentiviral vector packaged with pLV-SIN/puro-mock vector (upper panel) or pLV-SIN/puro-GPI-80 vector (lower panel), and the infected cells were incubated for 2 days. After incubation, the cells were stained with PE-conjugated anti-GPI-80 mAb (3H9) and Alexa 647-conjugated anti-phosphorylated p65-NF-κB mAb (93H1) and analyzed by flow cytometry. The representative analysis is from four independent experiments. The horizontal axis is phosphorylated p65-NF-κB (p-p65 NF-κB) level, and the vertical axis is GPI-80 level on the zebra-contour panels. (b) The p-p65 NF-κB MFI in mock-transfected PC3 cells. GPI-80- cell subset and GPI-80+ cell subset were separated from GPI-80-transfected cells, as shown in (a). The p-p65 NF-κB MFI was analyzed in mock-transfected cells (open circle), GPI-80- cell subset (open inversed triangle) and GPI-80+ cell subset (closed triangle). The data represent results from four independent experiments, and the statistical significance was calculated by one-way ANOVA with Bonferroni’s post-hoc test, compared with each other (***, p < 0.001; ns, not significant).

