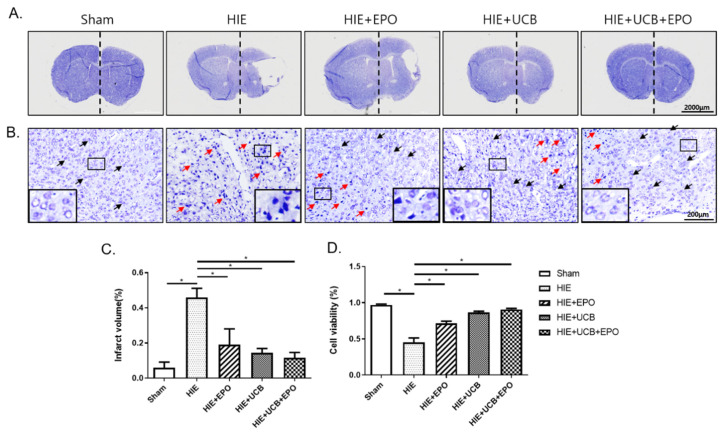
Figure 2.
Attenuation of brain damage and prevention of neuronal cell death in brains of HIE model in each treatment group. (A) Whole brain sections were stained with cresyl-violet and (C) the graph depicts the total volume of the infarct size in the affected hemisphere, which was estimated in comparison with that in the contralateral side by the ImageJ program. (B) The enlarged images show the morphology of the neuronal cell. Normal cells are indicated with black arrows and abnormal cells with red arrows. (D) The graph depicts the cell viability by the percentage of neuronal cells after each treatment group. Data shown as the mean ± standard error of mean. n = 3 per group. * p < 0.05 (one-way ANOVA).

