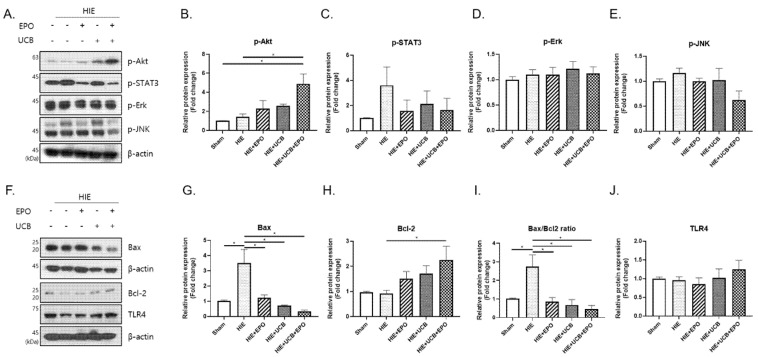
Figure 4.
Each treatment group up-regulated the anti-apoptotic effect via Akt signaling. (A) The levels of p-Akt, p-STAT3 (S727), p-Erk and p-JNK were detected using Western blotting to observe the consecutive changes after administration. (B–E) The graphs depict the band intensity by the ImageJ program for the band of image A. (F) The levels of related apoptosis proteins (Bax and Bcl-2) and TLR4 after hUCB and rhEPO treatment. (G,H,J) The graphs depict the band intensity and (I) represents the Bax/Bcl-2 ratio. Data shown as the mean ± standard error of mean. n = 3 to 8 per group, * p < 0.05 ((B,C,J) Kruskal–Wallis; (D,E,G–I) one-way ANOVA).

