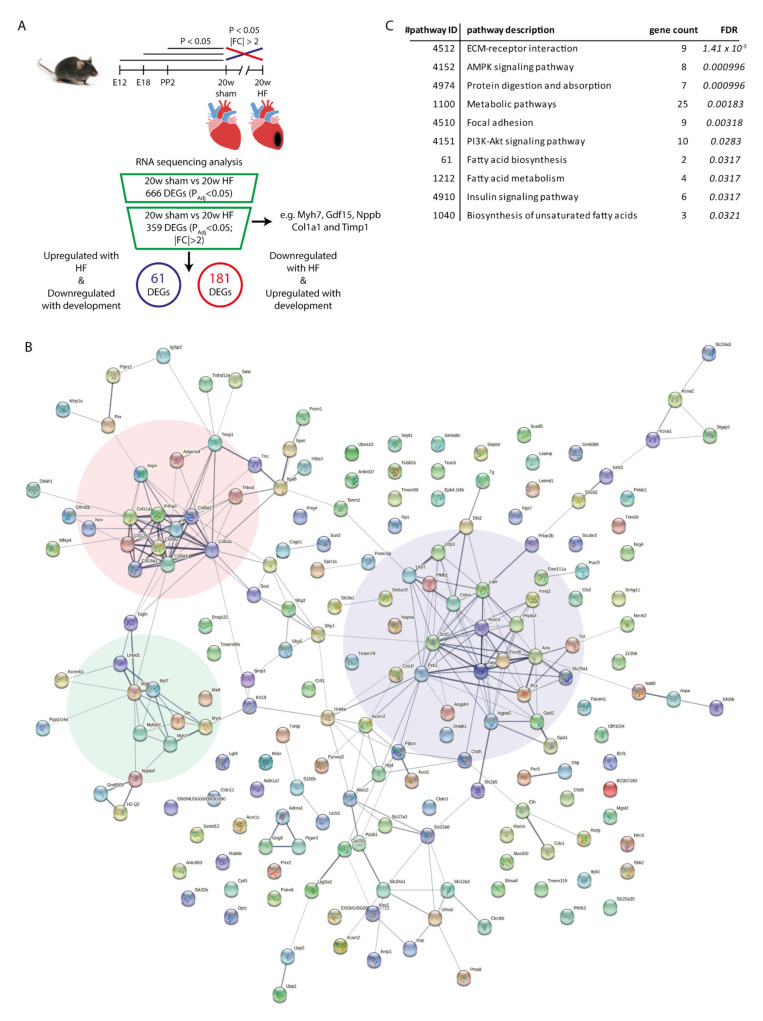
Figure 1.
Overview of study strategy and graphical representation of the data. (A) Graphical representation of the study design and RNA sequencing analysis. The flowchart showing the identification of genes contributing to the recapitulation of the fetal gene program. For each time point, n = 3 animals were used. (B) Protein-protein interactions (STRING-db) for de 242 differentially expressed genes (DEGs) contributing to the recapitulation of the fetal gene program. Clusters within the protein-protein interactions were identified for metabolism (blue), ECM (red) and sarcomere structure (green). (C) Pathway enrichment analysis identified several KEGG pathways to be enriched in the dataset.

