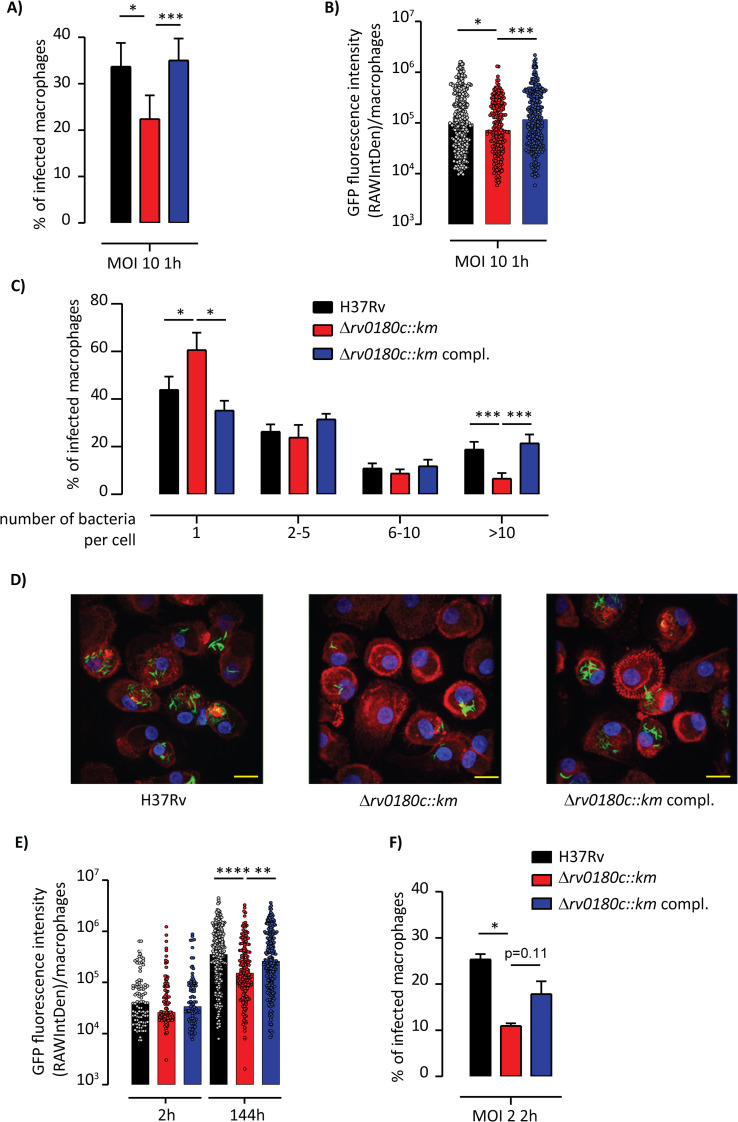
Fig 4. The Δrv0180c::km mutant is impaired in its ability to invade hMDMs.
(A-C) hMDMs were incubated with GFP-expressing strains (parental H37Rv, the Δrv0180c::km mutant, or the Δrv0180c::km complemented strain) at MOI 10:1 for 60 min at 37°C and processed for analysis by fluorescence microscopy. (A) Vertical bar plots indicated the percentage of hMDMs having ingested at least one bacterium, (B) Vertical scatter plots represented the distribution of GFP fluorescence intensity (reflecting bacterial loads) in individual hMDMs with 100 to 500 cells counted per condition, (C) Percentage of infected hMDMs as the function of the number of ingested bacteria. Ingested bacterial clumps are counted in the group of more than 10 bacteria (>to 10). The values are medians (B) or means +/- SEM (A, C) calculated from 6 donors. (D-F) hMDMs were incubated for 2h at 37°C with strains at MOI 2:1. After being infected, cells were washed and further incubated with fresh medium containing serum. At 2 h and 144 h post-infection, hMDMs were fixed and processed for confocal fluorescence microscopy. (D) Representative immunofluorescence images showing 144h-post-infected hMDMs. Bacteria are GFP-positive (green) and cells were stained for nuclei with DAPI (blue) and F-actin with rhodamine-phalloidin (red). Scale bar, 10μm. (E) Vertical scatter plots representing distribution of GFP fluorescence intensity in individual infected hMDMs with 100 to 500 cells counted per conditions (F) Vertical bar plots represented the percentage of infected hMDMs after 2h of infection. The values are medians (E) or means +/- SEM (F) calculated from 4 donors. For (A-C, F), the statistical significance was evaluated using the one-way ANOVA followed by the Bonferroni post hoc test. For (B,E), the statistical significance was evaluated using the Kruskal-Wallis rank sum test followed by Dunn’s multiple comparison test; *p<0.05, **p<0.01, ***p<0.001, ****p<0.0001.

