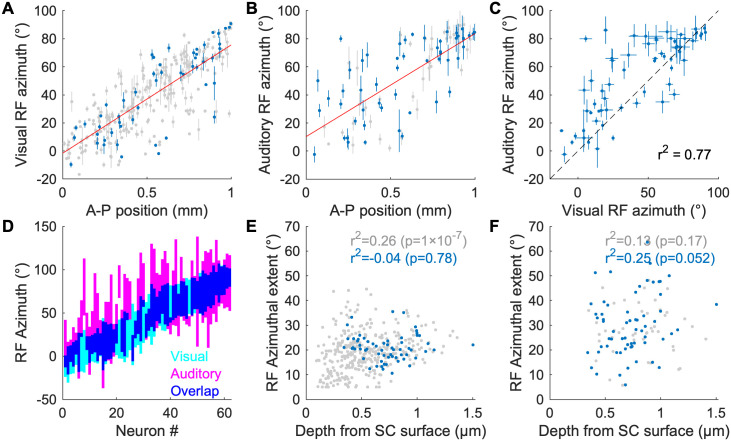
Fig 2. Topographic organization and receptive field properties of visual and auditory responsive neurons in the SC.
A, B: Scatter plots of estimated RF azimuth vs. A-P SC position for visually responsive (A) and auditory responsive (B) SC neurons. Blue points are neurons that respond to both visual and auditory stimuli; gray points are neurons that respond only to either visual (A) or auditory (B) stimuli. The red lines are linear fits. The error bars represent 1-σ errors (68% CIs) of the estimated azimuths inferred from function fitting. C: A scatter plot of visual and auditory RF azimuths for bimodal neurons. D: RF azimuthal extent of multimodal neurons. The neurons are sorted by their visual RF azimuth. The colored regions are ±1-σ width of the fitted Gaussians (visual RF) or corresponding radius of the Kent distribution (auditory RF; [17]). E, F: Scatter plots of the depth of the neurons and RF azimuthal extent for visually responsive (E) and auditory responsive (F) neurons. Blue points are neurons that respond to both visual and auditory stimuli; gray points are neurons that respond only to either visual (E) or auditory (F) stimulus.

