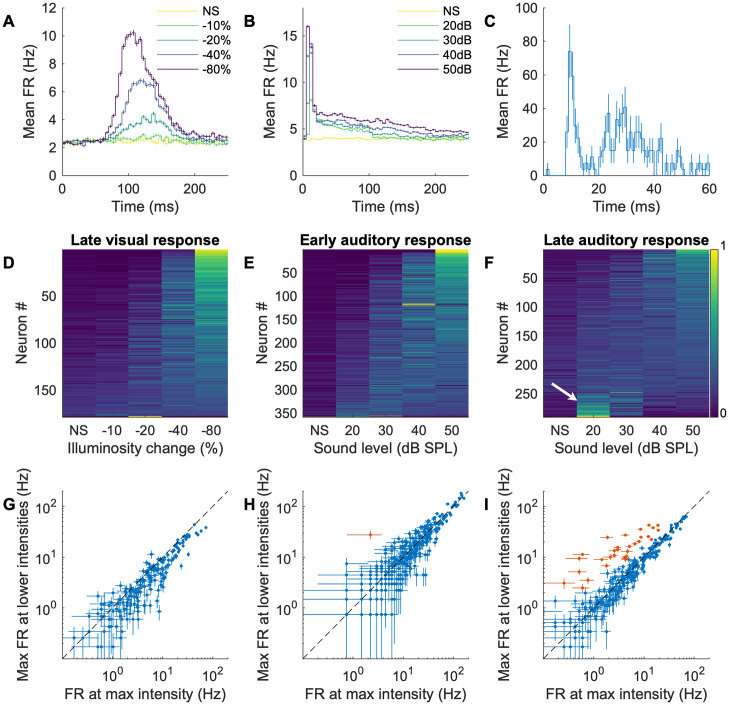
Fig 3. Temporal segregation and intensity profiles of SC visual and auditory responses.
A, B: Average responses over time of all (A) visually or (B) auditory responsive neurons. Darker colors indicate higher contrast (visual stimuli) or stronger intensities (auditory stimuli; NS: no stimulus). C: The auditory response of an example neuron over time (averaged over 30 trials at 85 grid locations) that has distinct early (<20ms) and late (>20ms) components. The error bars are SEM over the trials. D: Normalized responses to different visual intensities. The neurons are sorted by the center of mass of the intensity response (D-F). E: Normalized early responses to different auditory intensities. F: Normalized late responses to different auditory intensities. Note that a fraction of cells prefer low intensities over high intensities (white arrow). G-I: Scatter plots of the maximum (max) FR at non-max intensity vs the FR at max intensity (red points are non-monotonic neurons: y > x with p < 0.001) of (G) the visual stimulus response; (H) the early auditory response; and (I) the late response to auditory stimuli. The error bars are SEM over 30 trials.

