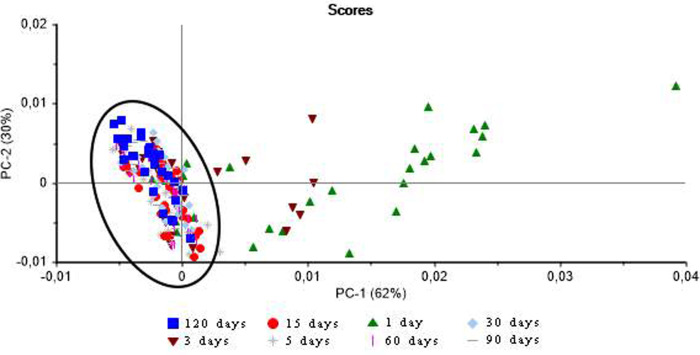
Fig 1. NIR spectra of the shells after different drying periods.
Plot of the principal component scores showing variation in the spectra obtained from the shells of the three Biomphalaria species after different periods of drying. The data points circled by the ellipse represent the groups with similar results.

