Figure 2.
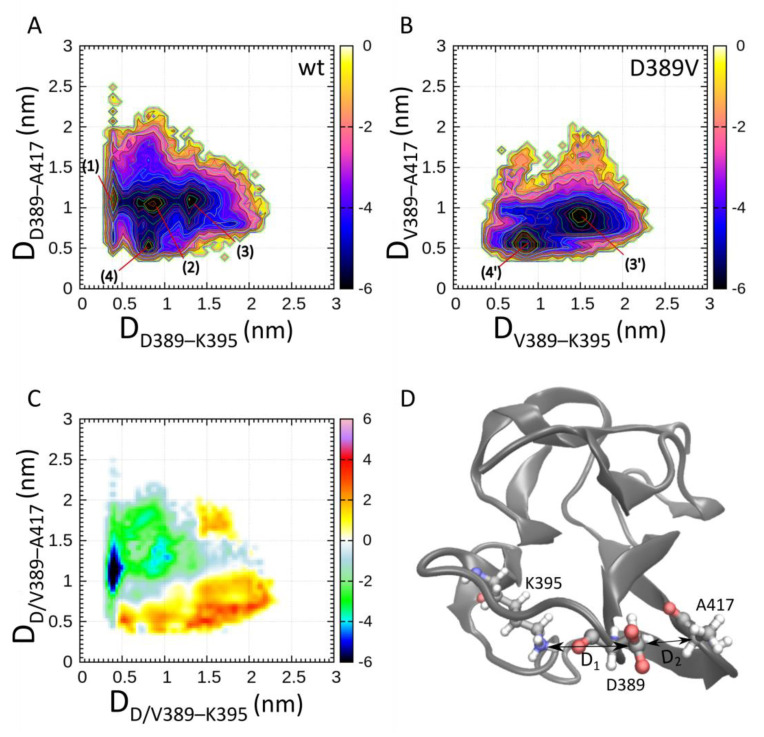
Free energy landscapes of MyBPC C2 wt (A) and D389V (B) domains generated using 100 ns of CORE-MD II simulations. The effect of the D389V mutation on the conformational space in the vicinity of the mutation is explored. We define the interatomic distances between D389V Cγ/V389 Cβ–K395 Nζ and D389V Cγ/V389 Cβ–A417 Cα as principal coordinates of the FEL. The scale of the color bar is given in units of kBT and represents the free energy (see Equation (5), Section 4.3). (1) to (4) indicate conformational states of C2 wt, and (3′) and (4′) indicate those of C2 D389V. (C) Free energy differences between C2 wt and C2 D389V (see Equation (6), Section 4.3). Negative values indicate an abundance of wt, and positive values indicate an abundance of D389V states. (D) Sample conformer extracted from State (4) in (A). C2 wt is depicted with the interacting residues D389, K395, and A417. D1 represents the x-axis and D2 represents the y-axis of the distances plotted in figures (A) to (C) for all conformations adapted over the course of the simulation.

