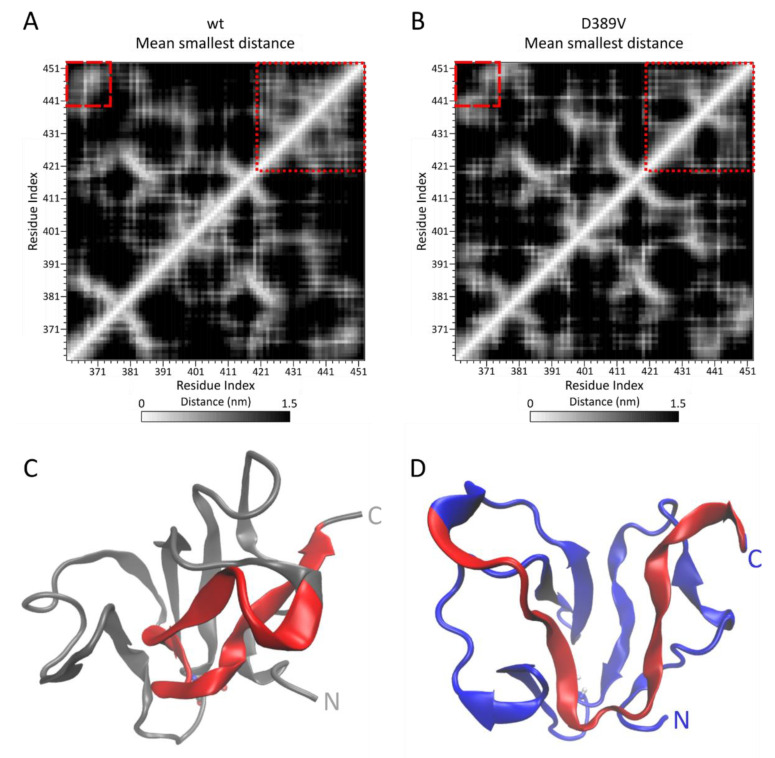
Figure 4.
Mean smallest distance matrices for MyBPC C2 wt (A) and D389V (B). The time-averaged minimum distance of each residue to every other residue is plotted in heat maps with white indicating the smallest distance and black indicating the largest distance ranging from 0 to 1.5 nm. This map reveals differences in the global conformational space of C2 wt and D389V. Dotted boxes indicate the β4–5–6 interstrand contacts within the C-terminus of the domain. Dashed boxes indicate the β1–6 interstrand contacts of C2 wt that are destabilized in C2 D389V (for topology see Figure 1D). (C,D) Sample structures of C2 wt (grey) and D389V (blue) to illustrate the differences in C-terminal conformation regarding the dotted boxes in (A,B). Residues 430 to 450 are marked in red.

