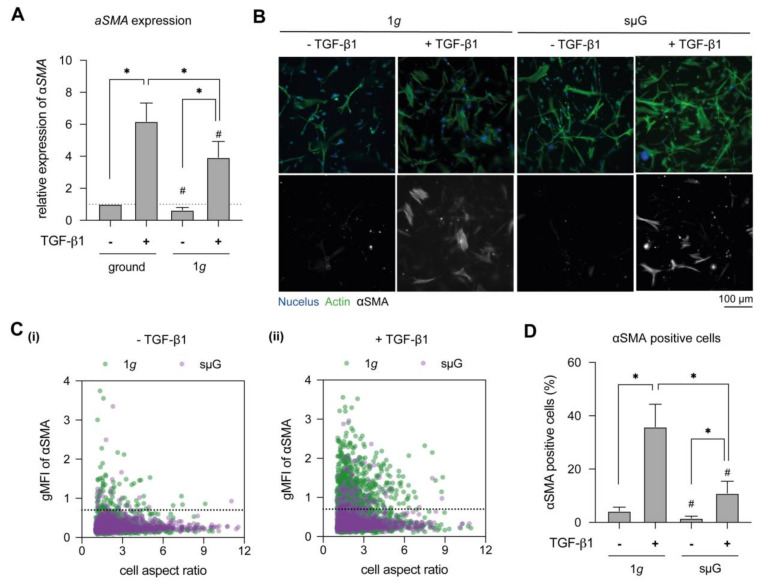
Figure 2.
Myofibroblast differentiation in dependence of TGF-β1 stimulation under 1g and sµG. Fibroblasts were cultured for 3 days in the presence and absence of TGF-β1 under 1g and sμG conditions. (A) Cells were analyzed regarding αSMA expression using RT-qPCR. Gene expression analysis was performed in four replicates. (B) Representative image of fibroblasts stained with DAPI (blue), Phalloidin (green) and αSMA (grey) antibodies. (C) Quantitative analysis of geometric mean of fluorescence intensity (gMFI) of αSMA and cell aspect ratio using a custom-made image analysis toolbox. The dashed line in C(i) and C(ii) represents the cut-off value, below which are the majority of low αSMA expressing cells without TGF-β1 under 1g condition. (D) Percentage of αSMA positive cells. The image analysis was performed at least in triplicate with four positions per sample. Data are shown as mean +/− SD. * indicates significant p ≤ 0.005. The character # represents the significance level of p ≤ 0.05 when compared to 1g at similar condition.

