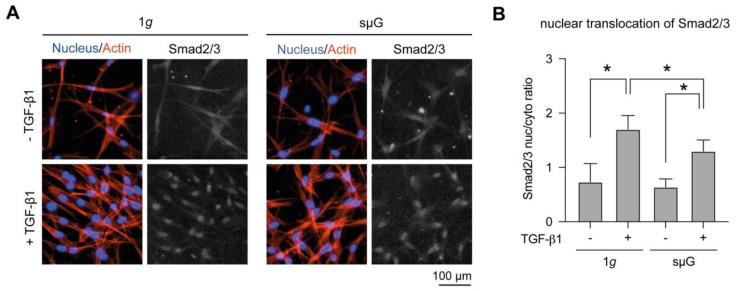
Figure 3.
Nuclear translocation of Smad2/3 in dependence of TGF-β1 stimulation under 1g and sµG. (A) Representative image of cells stained with Hoechst-33342 (blue), Phalloidin (red) and Smad2/3 (grey) antibodies. (B) The quantitative image analysis was performed at least in triplicate with four positions per sample. Data are shown as mean +/− SD. * indicates significant p ≤ 0.005.

