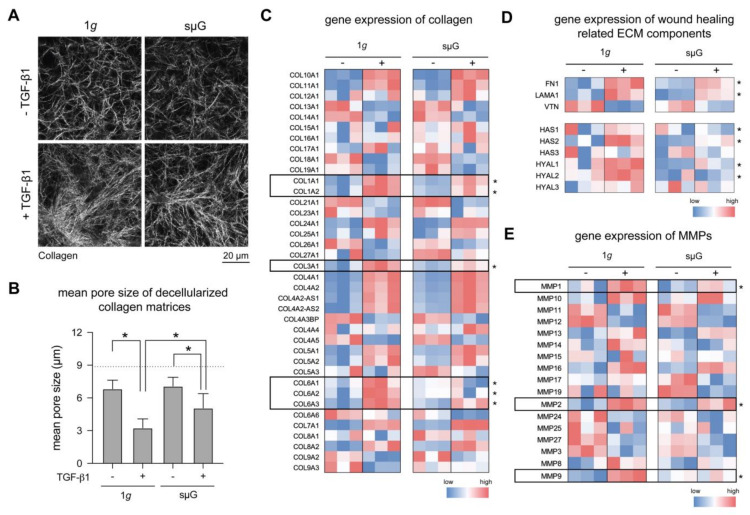
Figure 4.
Matrix remodeling and ECM gene expression under 1g and sµG conditions. (A) Representative images of decellularized collagen matrices. Matrices were analyzed regarding (B) pore size. The image analysis was performed at least in triplicate with four positions per sample. Data are shown as mean +/− SD. * indicates significant p ≤ 0.05. Gene expression using RNA-Seq data of (C) collagens, (D) wound healing related ECM factors, and (E) matrix metalloproteinases (MMPs) in both 1g and sμG conditions. Data are shown as a heatmap using colors on a scale from red (high expression) to blue (low expression). Statistical significance test was performed for TGF-β1-treated samples between 1g and sµG conditions for Figure 4C–E, which is indicated by * for p-value ≤ 0.05. The experiment was performed in three replicates.

