Figure 5.
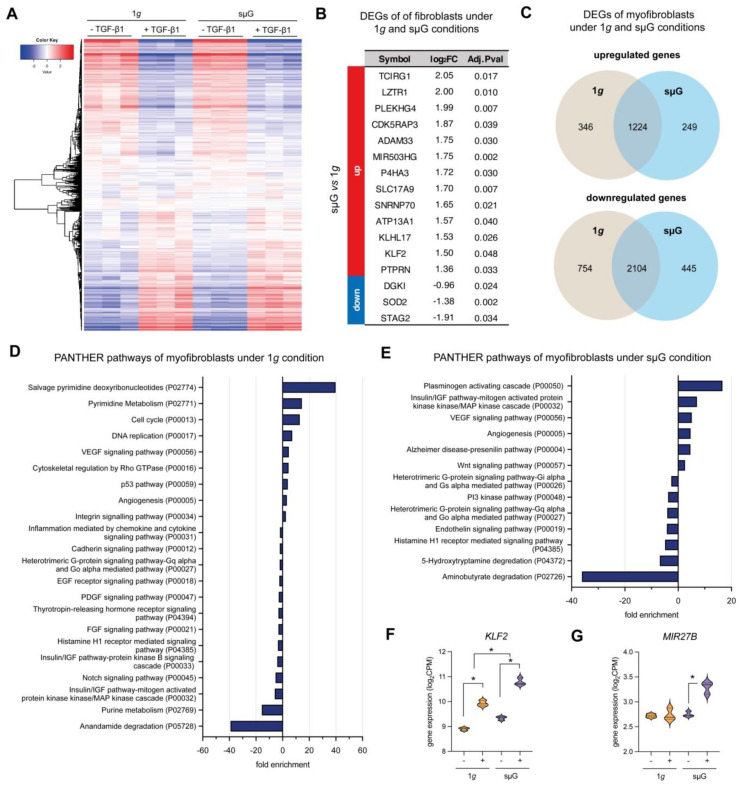
RNA-Sequencing analysis of fibroblast and myofibroblast under 1g and sµG conditions. (A) Heat map of overall gene expression levels in fibroblasts and myofibroblasts under 1g and under sµG. DEGs were analyzed using DESeq2 with FDR cutoff ≤ 0.05 and FC ≥ 2.0 using DESeq2 (B) Table of differentially expressed genes (DEGs) with log2 fold change (log2FC) and adjusted P-value of fibroblasts cultured under 1g and under sµG. Up- and downregulated genes were compared between sµG and 1g conditions. (C) Venn diagram of up- and down-regulated DEGs of myofibroblast cultured under 1g and under sµG. The DEGs were analyzed for enriched biological pathways using statistical overrepresentation tests using the PANTHER pathway for (D) 1g and (E) sµG conditions. Gene expression of specific DEGs which has been reported to be involved in inhibition of fibroblast differentiation, namely (F) KLF2 and (G) MIR27B. Data are shown as a violin plot; * significance level of p < 0.05. The experiment was performed with three replicates.

