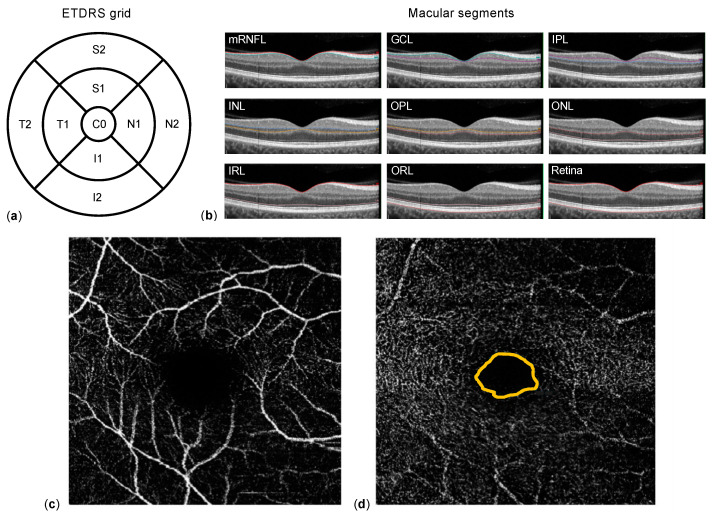
Figure 1.
Methodology. (a) Representation of the Early Treatment Diabetic Retinopathy Study (ETDRS) grid 1, 2.22, 3.45 mm, which contains nine subfields (C0: center; S1 and S2 superior, N1 and N2 nasal, I1 and I2 inferior, and T1 and T2 temporal) and is used for thickness measurements. The macular segments (b) are separated semi-automatically by optical coherence tomography (OCT) software: nerve fiber layer (NFL), ganglion cell layer (GCL), inner plexiform layer (IPL), inner nuclear layer (INL), outer plexiform layer (OPL), outer nuclear layer (ONL)—together inner retinal layers (IRL)—and outer retinal layers (ORL). Example of the superior (c) and deep (d) vascular plexus of the macula obtained using OCT-angiography; the foveal avascular zone is located within the orange line in (d).

