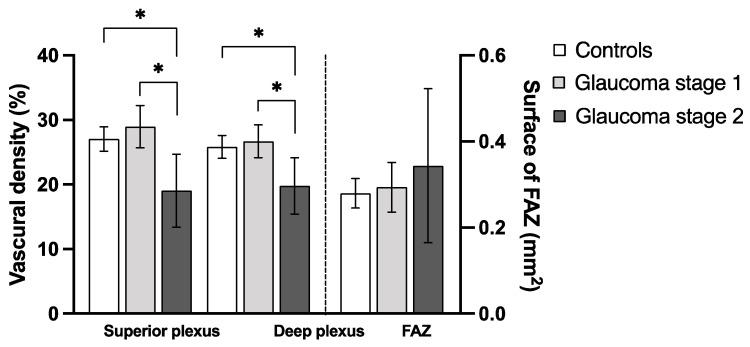
Figure 3.
Superficial and deep vascular density of the macula differ between glaucoma patients and controls. This figure shows the comparison (mean and 95% confidence interval) of optical coherence tomography-angiography (OCTA) parameters between healthy controls (white bars) and glaucoma patients of stage 1 (light grey) and 2 (dark grey). Statistically significant results (p < 0.05) of one-way ANOVA are marked with an asterisk *. Abbreviation: FAZ, foveal avascular zone.

