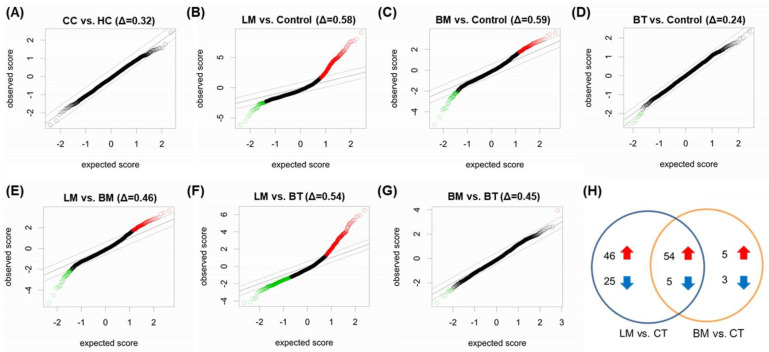
Figure 4.
Significance analysis of microarrays shows different expression levels of miRNAs between patient groups. (A) HC and CC, (B) LM and Controls (HC + CC), (C) BM and Controls, (D) BT and Controls, (E) LM and BM, (F) LM and BT, and (G) BM and BT. (H) The Venn diagram showed numbers of miRNAs that differentially expressed in LM and BM samples. The intersection represents common miRNAs. The red arrow indicates upregulated miRNAs and the blue arrow indicates downregulated miRNAs. Delta values at a 10% false discovery rate are presented at the top of each graph. Abbreviations: BM, brain metastasis; BT, brain tumor, CC, cancer control; HC, healthy control; LM, leptomeningeal metastasis.

