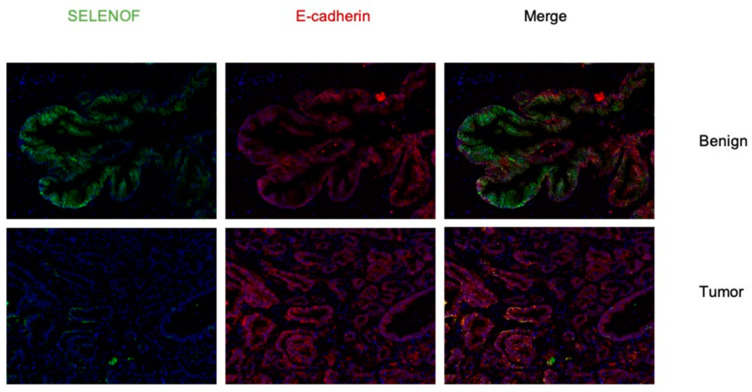
Figure 1.
SELENOF levels are lower in prostate cancer compared to benign prostatic tissue. A representative immunofluorescent image of SELENOF (green) and E-cadherin (red). The top images show a region of benign prostatic tissue and the bottom images represent a region of prostate cancer. (Magnification = 20×). Staining with anti-E-cadherin antibodies was included both as a marker for the outer membrane and to restrict quantification of images to epithelial cells.

