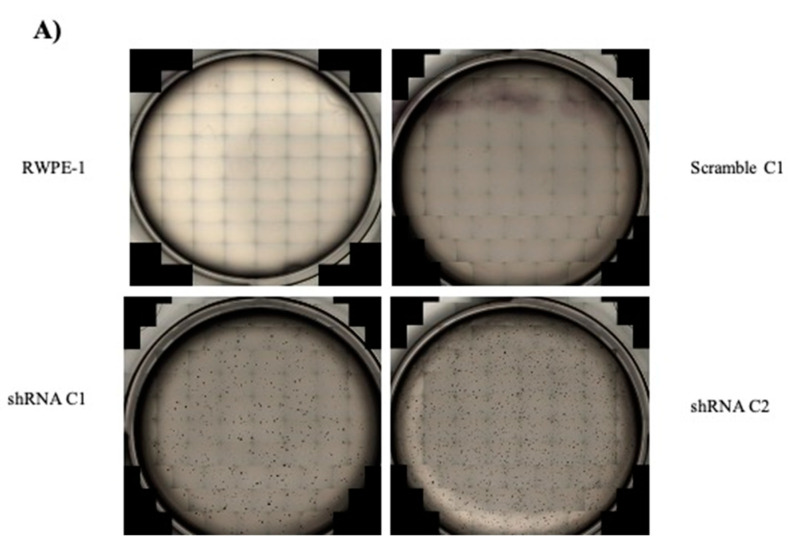
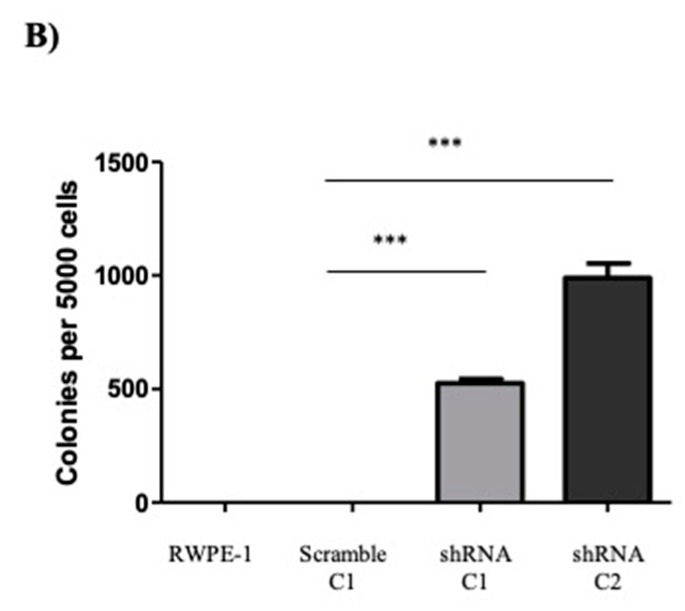
Figure 3.
Reduction of SELENOF in RWPE-1 cells results in anchorage-independent growth. (A) Representative images of cells cultured in soft agar used to quantify the number of colonies formed. RWPE-1 and RWPE-1 scramble C1 did not form any colonies. (B) Quantification of the average number of colonies formed per 5000 cells plated. Data are represented in mean ± SEM, n = 3, and a two-tailed paired t-test was used to determine statistical differences *** p < 0.001.


