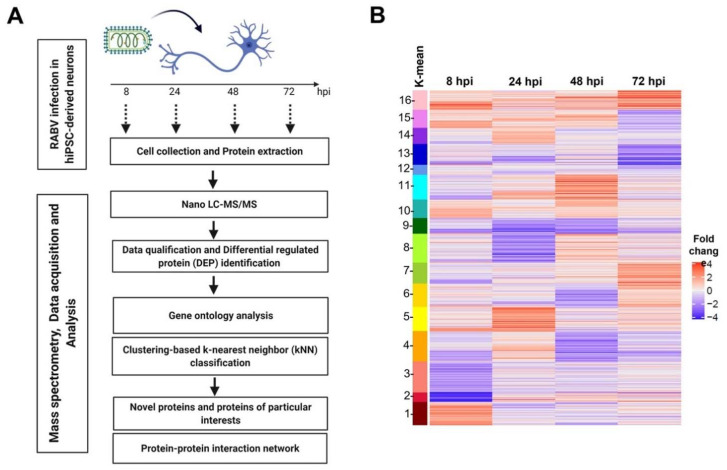
Figure 5.
Schematic diagram of proteomic analysis and differential expression protein (DEP) identification in RABV-infected hiPSC-derived neurons. (A) Schematic workflows of sample preparation and bioinformatic analysis. (B) K-means clustering demonstrated 16 clusters of expressed proteins changing in RABV-infected neurons at 8, 24, 48, and 72 hpi.

