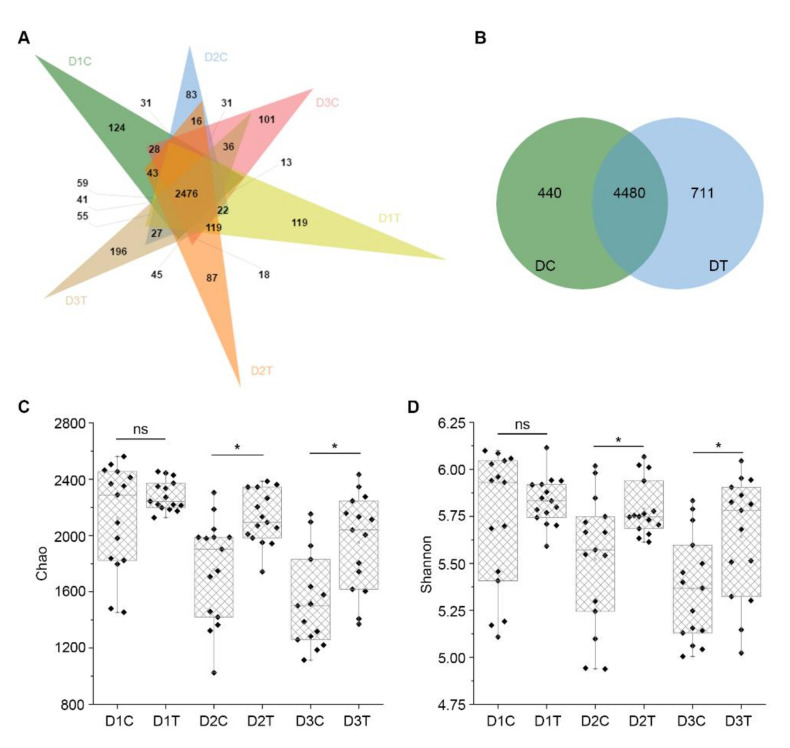
Figure 5.
Analysis of bacterial diversity in soil samples. (A) Venn diagram of OTUs between each soil group in bacteria. DT refers to soil samples derived from plots treated with Bacillus subtilis strain Bv17, and those that came from plots treated with water are labeled DC. Soil samples were collected at two-month intervals three times (D1C, D1T, D2C, D2T, D3C, and D3T). (B) Venn diagram of OTUs between DC and DT. (C) The box diagram of alpha diversity of the Chao index in each soil groups. (D) The box diagram of alpha diversity of the Shannon index in each soil groups. Asterisks indicate statistically significant differences at p < 0.05 according to pairwise t-tests, and ns means no significant difference between treatments.

