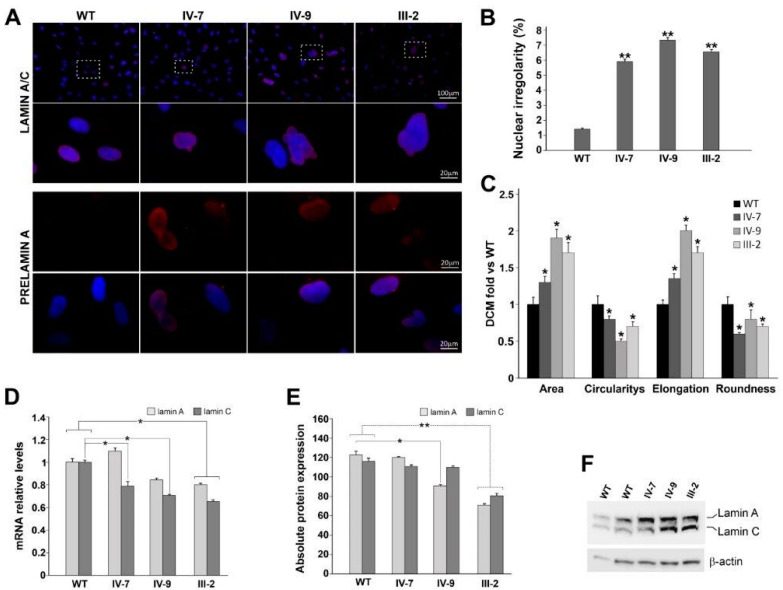
Figure 3.
(A) Representative immunolabeling for lamin A/C (red) and Prelamin A (red) of WT and DCM HDFs (IV-7, IV-9, and III-2). Nuclei are counterstained with Hoechst 33,342 (blue). Scale bar 20 µm, 100 µm. (B) Percentage of WT and DCM cells with abnormal nuclear irregularities revealed in HDFs patients. Results represent three independent experiments with significant differences between WT and DCM HDFs (** p < 0.01). (C) Bar graphs represent the four parameters relative to nuclear shape (area; circularity; elongation; roundness); they are reported as mean values ± SD (fold DCM vs. WT) of three independent experiments. Significant differences are denoted by the p-value (Student’s two-tailed t-test; * p < 0.05. (D) RT-qPCR of lamin A and C transcripts in WT and DCM HDFs; GAPDH was used as reference gene. Data are from three independent experiments and represented as mean ± SD (* p < 0.05). (E) Densitometric analysis of Western blot performed on WT and DCM HDFs, showing the intensity of the band corresponding to lamin A and C normalized versus β-actin levels. WT densitometric value is the average between two different controls (* p < 0.05; ** p < 0.01). Data are presented as mean ± SD. (F) Representative Western blot of lamin A and C; β-actin is used as housekeeping gene.

