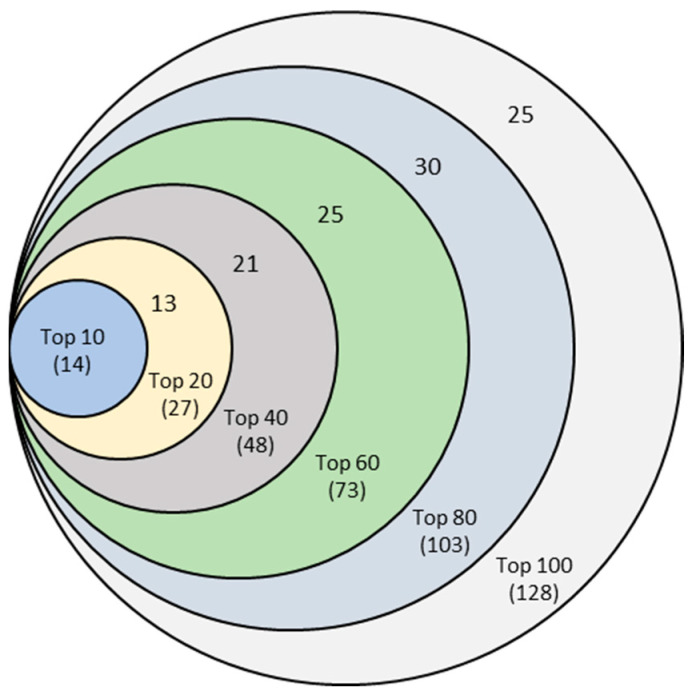
Figure 4.
Venn diagram of six sets of unique features identified from six mrCAE systems. The mrCAE consisted of 10, 20, 40, 60, 80, and 100 runs. Each of these runs was conducted to select 100 features. The smallest set (light blue), containing 14 features, represents the unique features coming from six sets of 10 most frequent features from 10-, 20-, 40-, 60-, 80-, and 100-run mrCAE systems. Similarly and so on, the 2nd smallest set contains 27 (14 + 13) unique features from six sets of Top-20 features selected.

