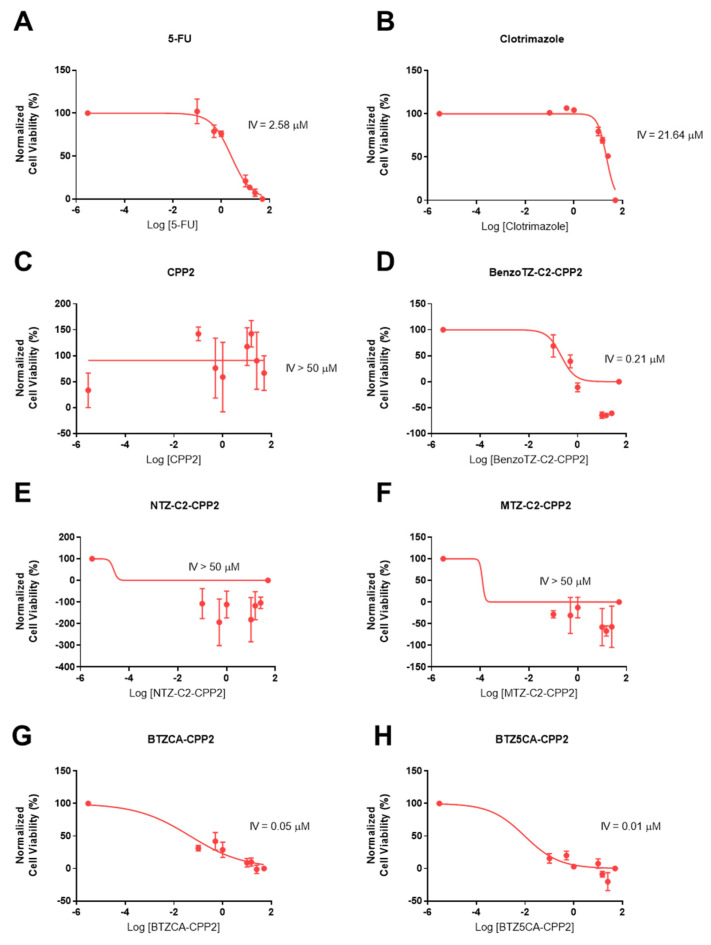
Figure 3.
Concentration–response curves of 5-FU (A), CLZ (B), CPP2 (C), BenzoTZ-C2-CPP2 (D), NTZ-C2-CPP2 (E), MTZ-C2-CPP2 (F), BTZCA-CPP2 (G) and BTZ5CA-CPP2 (H) on HT-29 cells based on the results obtained by MTT assay. The results represent the mean ± SEM of three independent experiments performed in triplicate.

