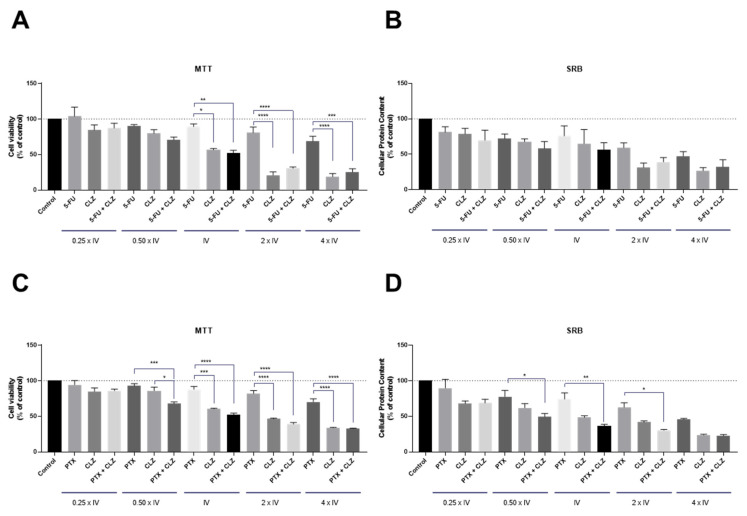
Figure 9.
Cytotoxic effects of the combination of CLZ with (A,B) 5-FU and (C,D) PTX on the viability (right panel) and cell protein (left panel) content of HT-29 and PC-3 cells, respectively. Cell viability and protein content were assessed by MTT and SRB assays, respectively, after 48 h of exposure to each treatment. The results are expressed in the percentage of cell viability relative to untreated control cells. *, **, *** and **** indicate p < 0.05, p < 0.01, p < 0.001 and p < 0.0001, respectively, when compared to the control. All data are presented as the mean ± SEM of three independent experiments.

