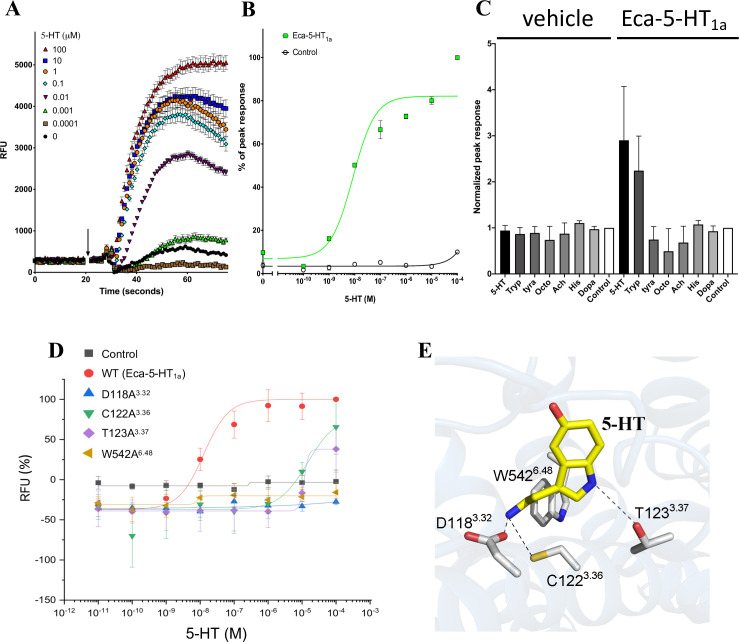
Fig 3. Heterologous expression of Eca-5-HT1a receptor.
A) Time resolved measurements of Ca2+ accumulation (measured as raw fluorescence units, RFU) in cells expressing the cestode Eca-5-HT1a before and after addition of different concentrations of 5-HT (arrow, concentrations indicated in legend in μM). B) Concentration-response curve measuring peak amplitude of 5-HT evoked fluorescence change (measured as a percentage) in cells expressing Eca-5-HT1a (green closed squares), or untransfected HEK293-GNA15 cell line (open circles). C) Bar graph showing normalized peak responses in cells transfected with the new receptor to indicated neurotransmitters (10 μM). D) Concentration-response curve measuring 5-HT evoked fluorescence change (measured as raw fluorescence units, RFU) in cells expressing wild type Eca-5-HT1a (red solid dot), or the following mutants: D118A3.32 (blue triangle), C122A3.36 (green inverted triangle), T123A3.37 (purple rhombus) and W542A6.48 (brown triangle). Black solid squares represent the untransfected control (HEK293-GNA15 cell line). E) molecular model of the orthosteric binding pocket in Eca-5-HT1a, showing the role of the mutated residues in serotonin binding. The molecule shown in yellow represent 5-HT. The gray sticks represent the R groups from the amino acids mutated here. In all cases, the amine groups are shown in blue, thiol group is shown in yellow and hydroxyl groups in red. Hypothetical interactions between the 5-HT molecule and receptor mutated residues were marked by dotted lines. Abbreviations are: 5-HT, serotonin; Tyra, tyramine; Octo, octopamine; Ach, acetylcholine; His, histidine; Dopa, dopamine. For panels A) and B), each point represents the average of three biological experiments with three technical replicates each. For panel C), each point represents the average of two biological experiments with three technical replicates each. Error bars corresponds to the standard error of the mean.

