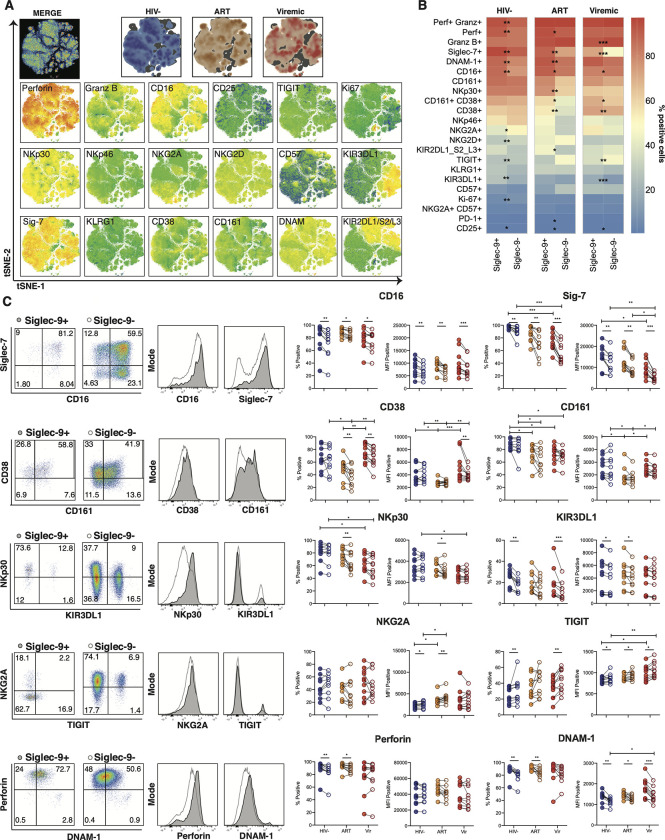
Fig 2. The phenotype of Siglec-9+ CD56dim NK cells.
(A) Global t-SNE visualization of Siglec-9+ CD56dim NK cells for all individuals pooled, with Siglec-9+ CD56dim NK cells from HIV-, HIV+ ART+, and HIV+ viremic individuals concatenated and overlayed (dimensionality reduction performed from 234,000 cells in 21 dimensions, 10,000 iterations, excluding parameters used to define the population: time, FSC, SSC, viability, CD14, CD19, CD3, and Siglec-9). Bottom: t-SNE projections of the 18 indicated proteins expression. (B) Heatmaps showing the percentages of Siglec-9+ and Siglec-9- CD56dim NK cells expressing the indicated activation and inhibitory markers in HIV-, HIV+ ART+, and HIV+ viremic individuals. (C) Comparative analyses of frequency (% positive) and expression (MFI of the positive population) of CD16, Siglec-7, CD38 CD161, NKp30, KIR3DL1, NKG2A, TIGIT, Perforin, and DNAM-1 on Siglec-9+ vs. Siglec-9- CD56dim NK cells. Left: Representative flow plots and histograms from HIV+ ART-suppressed donors are shown. Numbers inside the plots represent the gated percentage within the parent population. Mann-Whitney rank test was used to compare between groups. Paired Wilcoxson test was used to compare Siglec-9+ and Siglec-9- within each group. ***p<0.001, ** p<0.01, *p<0.05. n = 10 HIV-negative controls, 11 HIV+ viremic, and 10 HIV+ on suppressive ART.

