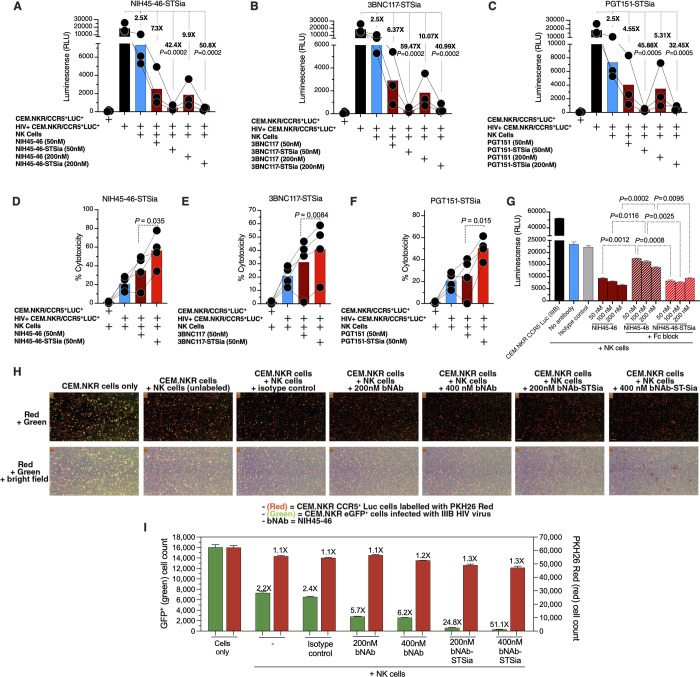
Fig 7. bNAbs-STSia conjugates promote higher NK cytotoxicity against HIV+ cells compared to bNAbs alone.
(A-C) Killing assay using HIV-infected CEM-NKR CCR5+ Luc+ cells as targets and HIV-negative primary NK cells as effectors (n = 3 donors; assays from each donor were performed in 2–4 replicates, and the average of these replicates was used for analysis) at E:T ratio of 10:1. Luminescence was measured as a marker of intact (unkilled) HIV+ cells. (A) NIH45-46 and its conjugate. (B) 3BNC117 and its conjugate. (C) PGT151 and its conjugate. P-values were calculated using paired ANOVA with post-hoc Holm-Sidak method (comparing each condition against the HIV+ cells alone condition). (D-F) Killing assay using HIV-infected CEM-NKR CCR5+ Luc+ cells as targets and HIV-negative primary NK cells as effectors (n = 4 donors; assays from each donor were performed in 2–4 replicates, and the average of these replicates was used for analysis). Cytotoxicity was assessed by the LDH release assay at an E:T ratio of 10:1. (D) NIH45-46 and its conjugate. (E) 3BNC117 and its conjugate. (F) PGT151 and its conjugate. p-values were calculated using paired t-tests. (G) NK cells were treated with human Fc receptor blocking solution prior to co-incubation with HIV-infected CEM.NKR CCR5+ Luc+ cells. Luminescence was measured following 16 h incubation at a 10:1 E:T ratio. Unpaired ANOVA with post-hoc Dunnett T3 method (to correct for multiple comparisons) was used for statistical analysis between the indicated groups. (H) Effector NK cells were isolated from PBMC of an ART-suppressed HIV+ donor (ART09) and co-cultured with a mixture of HIV-uninfected PKH26-labeled CEM.NKR CCR5+ Luc+ (red cells) and HIV-infected CEM.NKR eGFP+ cells (green cells). Cell mixture was treated with NIH45-46, NIH45-46STSia, or isotype control. After 24 of co-culture, the Celigo image cytometer was used to directly visualize and count the number of PKH26-labeled (red) and GFP+ (green) target cells. The panel shows representative images from two independent experiments. This experiment was performed in quadruplicate at E:T 10:1. (I) Plot of the raw GFP+ green (HIV-infected) cell count (left y-axis) and red PKH26-labeled (HIV-uninfected) cell counts (right y-axis) from (H). The fold reduction compares the average of each condition to the cell-only condition.

