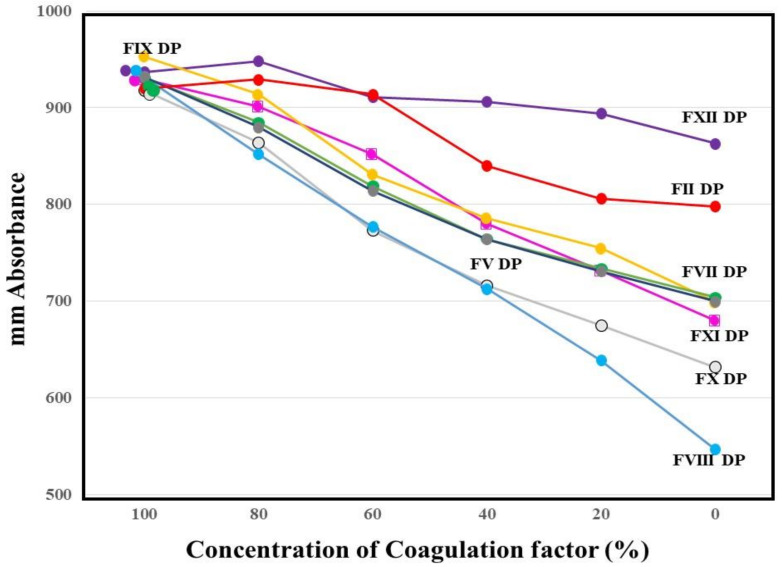
Figure 3.
Mixing test between calibration plasma and plasma deficient of each factor using a clot waveform analysis for thrombin time (0.5 IU/mL of thrombin). The height of fibrin formation at 100 s was plotted. The mean values of three assays are shown. The standard deviation in each assay was less than 45 mm absorbance. DP, deficient plasma.

