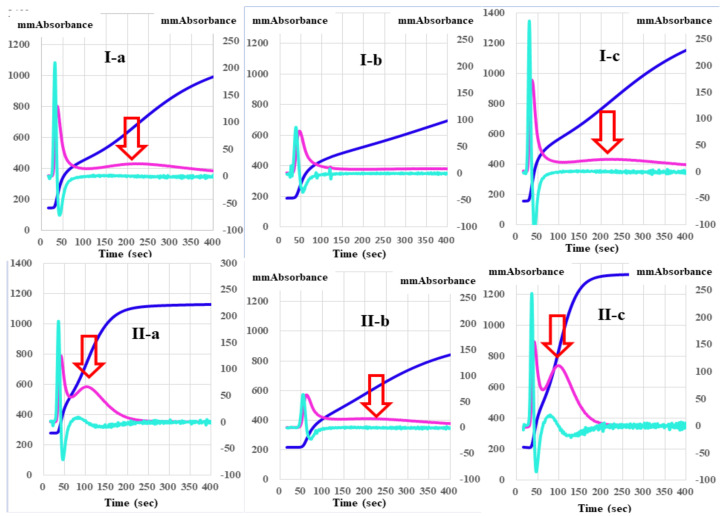
Figure 4.
A clot waveform analysis of thrombin time (0.5 IU/mL) in platelet-poor plasma (I) and platelet-rich plasma (II) from healthy volunteers (a), patients with thrombocytopenia (b), and patients with malignant disease (c). Navy line, fibrin formation curve; red line, 1st derivative curve (velocity); light blue, 2nd derivative curve (acceleration); red arrow shows 1st DPT-2.

