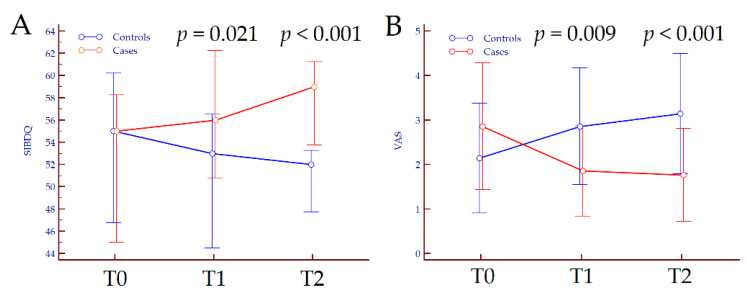
Figure 2.
Variation of Short Inflammatory Bowel Disease Questionnaire score (A) and visual analogue score (B) from T0 to T2 according to treatment. p values refer to the comparison between groups at each time-point and were calculated by Mann–Whitney. Abbreviations: SIBDQ, Short Inflammatory Bowel Disease Questionnaire; T, timepoint; VAS, visual analogue scale.

