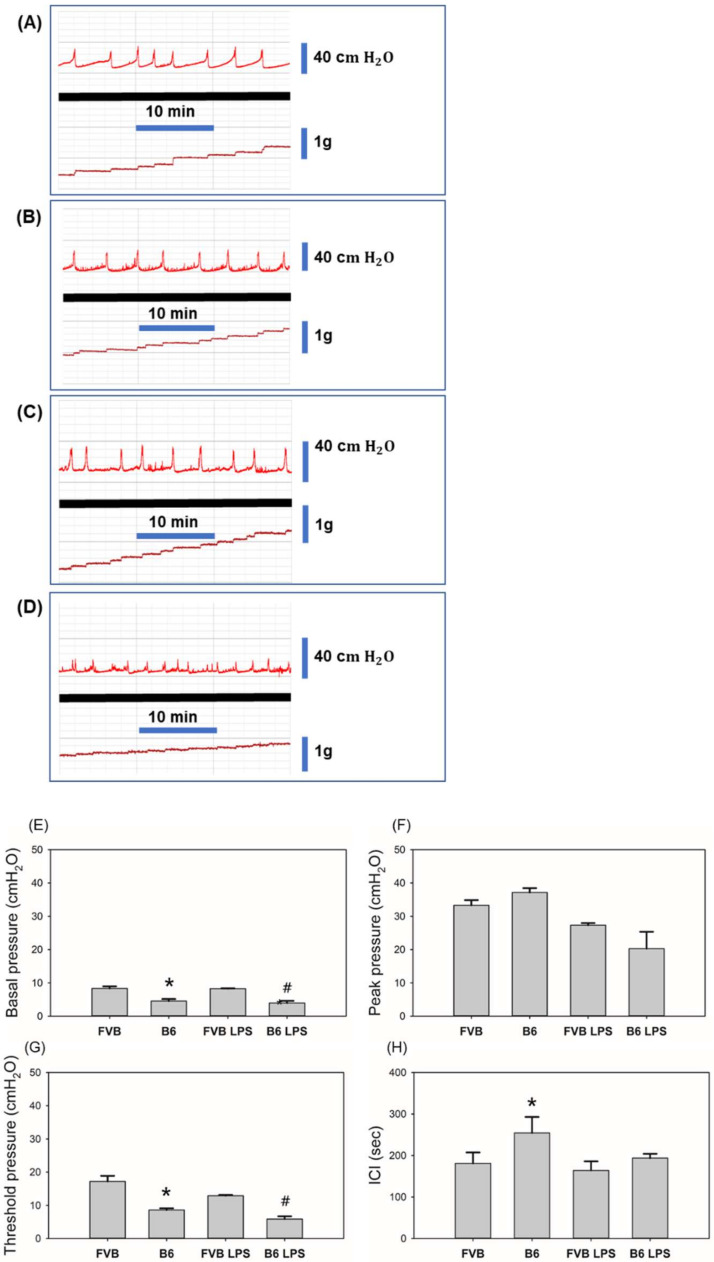
Figure 3.
CMG data line charts of (A) FVB control, (B) B6 control, (C) lipopolysaccharide (LPS)-treated FVB, and (D) LPS-treated B6 mice. Bladder pressure is shown above the bold black line, and output volume below. CMG test results of all groups are shown for (E) basal pressure, (F) peak pressure, (G) threshold pressure, and (H) ICI. * B6 compared to FVB; # B6 LPS compared to FVB LPS.

