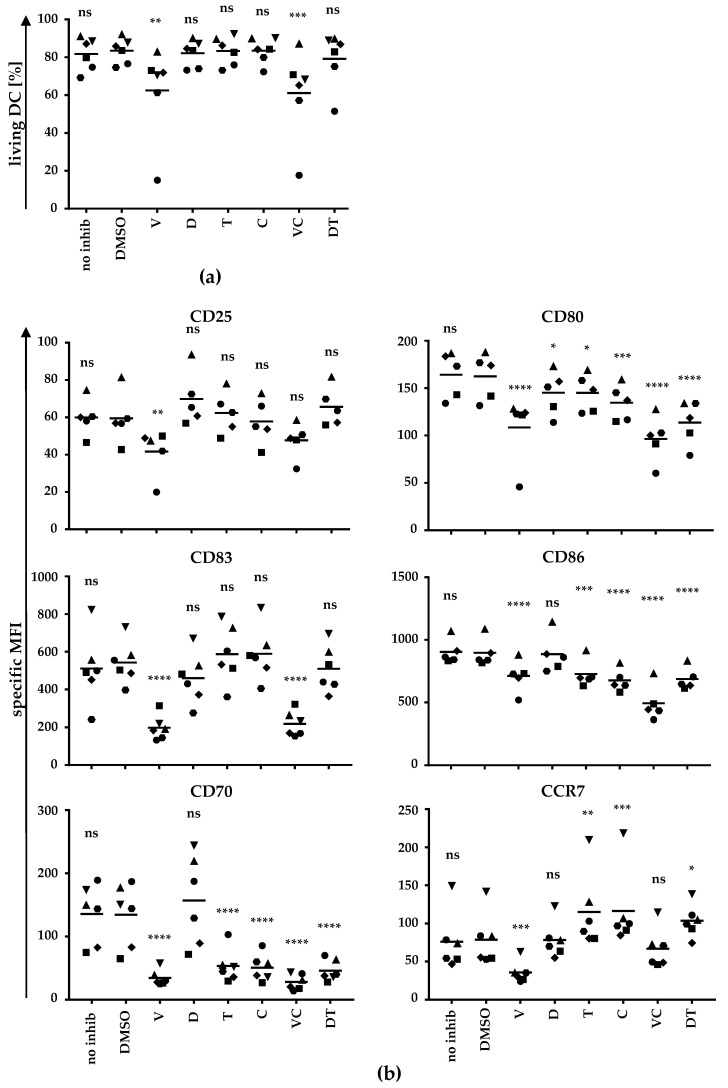
Figure 2.
BRAF and MEK inhibitors partially inhibit DC maturation: moDCs were generated and treated as described in Figure 1. After 24 h, cells were harvested, stained for the indicated markers, and analyzed by flow cytometry. For the analyses of surface molecule expression of the indicated markers, cells were gated by forward (FSC) and side scatter (SSC). (a) The percentage of DCs in the life gate after treatment with different BRAF and/or MEK inhibitors or controls was determined. (b) The expression of surface markers is depicted as specific MFI (i.e., MFI after subtraction of background MFI of the respective isotype control antibodies). Data of six donors (represented by different symbols) assessed in independent experiments are shown. Bars indicate mean values. p-values were determined by one-way ANOVA. In Dunnett’s multiple comparisons test, all conditions were tested against the solvent control DMSO. * p ≤ 0.05, ** p ≤ 0.01, *** p ≤ 0.001, **** p ≤ 0.0001, ns: p > 0.05.

